|
Summary
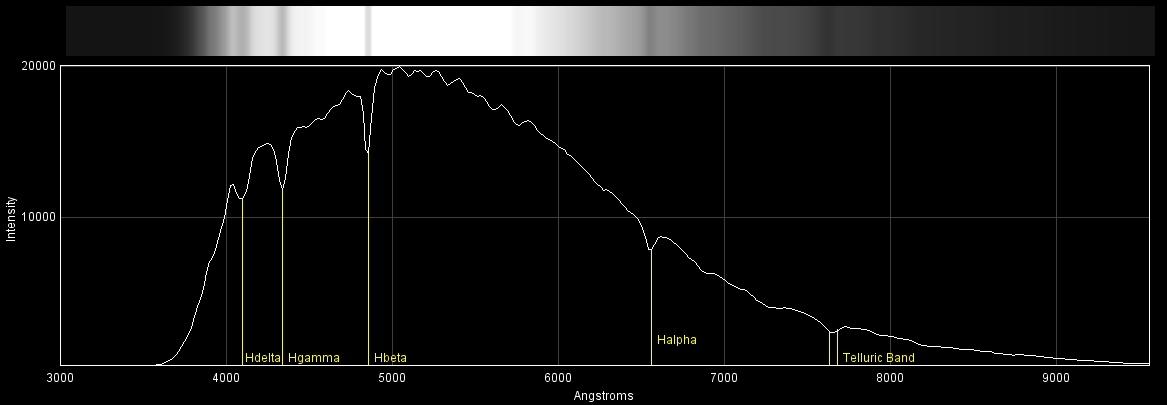
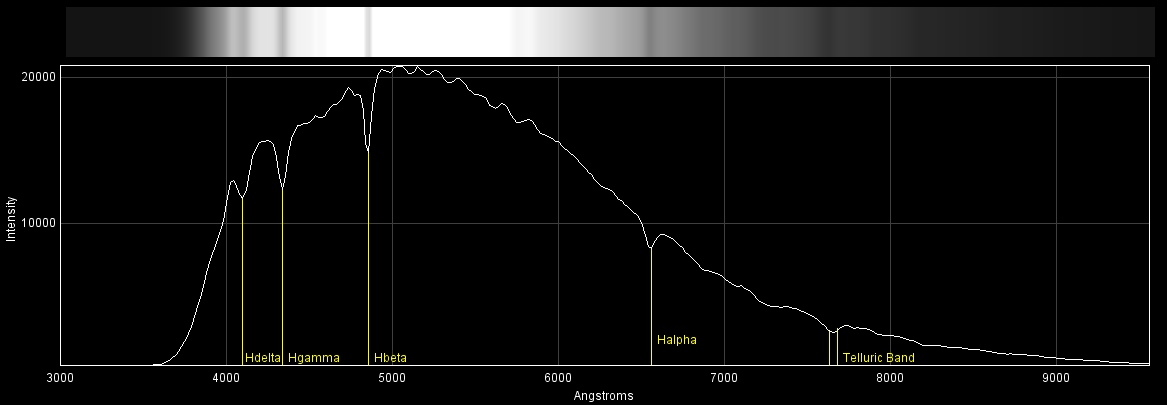
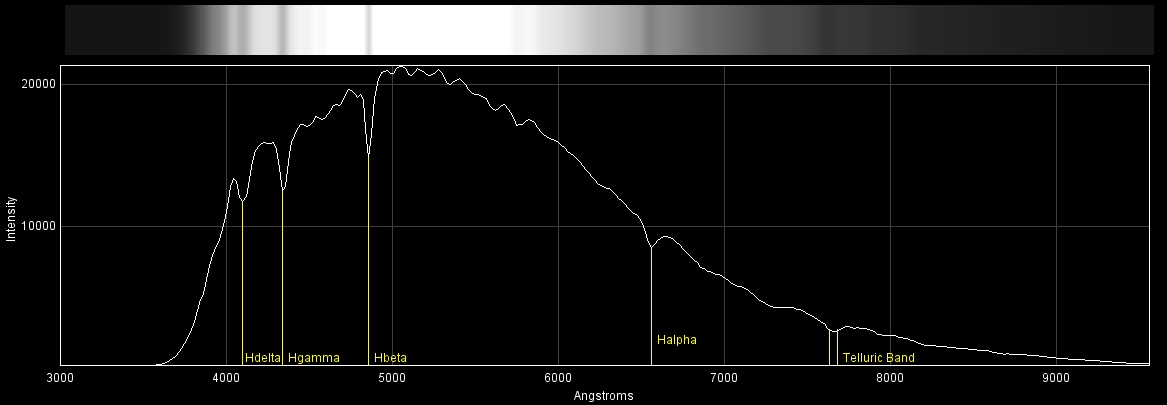
- These four images were used to calibrate the spectrum measurements for August 6, 2010.

Spectroscopy Team
The spectrum image was taken by the below
spectroscopy team.
Spectrum Calibration
- The star Vega H-alpha absorption line was used to calibrate the x axis in
angstroms by measuring the distance of the grating to CCD.
- Images of Vega spectrum were taken at the beginning of each evening imaging session.
- Vega H-alpha absorption line distance was measured from the centroid of the spectral order zero.
- The below table shows the four images used and the calculated grating distance between the grating and the CCD.
- The grating distance mean is 18.3272 mm with a standard deviation of 0.01414 mm.
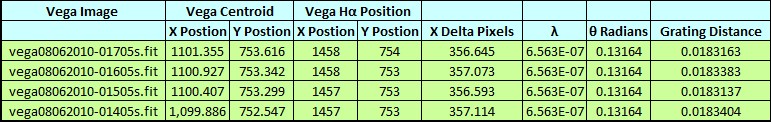
SpectrumCalWithVega08062010.xlsx
- The first calibration equation is Ĺ =SIN (ATAN (0.0000068* pixel distance /.01832719265135))*0.000005*10000000000
- Ĺ is light wavelength measured in angstroms.
- 0.0000068 m is QSI532ws pixel size (6.8 microns).
- Pixel distance is the horizontal pixel distance from the centroid of spectral order zero.
- .01832719265135 is the distance of the grating to CCD (18.3272 mm).
- 0.000005 m is the distance between the Rainbow Optics grating filter lines (200 lines/mm grating).
- 10000000000 converts the wavelength from meters to angstroms.
- The second calibration equation is a linear x=Ay+B between absorption lines to align the H-alpha, H-beta, H-delta and H-gamma absorption lines of image vega08062010-01605s to the CCD pixel distance to the centroid of the zero mode image.
|