<<PREVIOUS -
HOME -
CONTENTS -
NEXT>>
PMO INDEX -
![]()
Quasar KUV18217+6419 Redshift Analysis
Version December 23, 2010
|
|
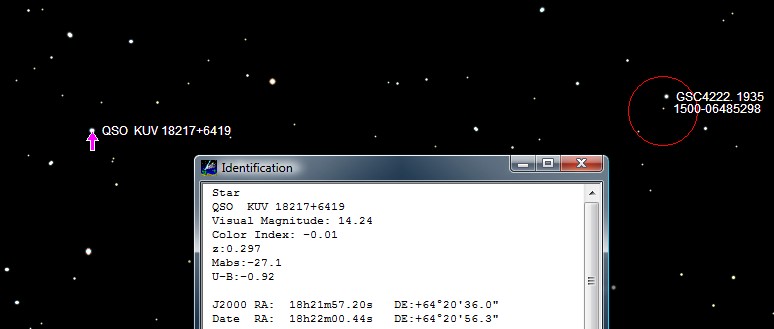
In the above image Quasar KUV18217+6419 round spectral order zero is in the upper left corner and it's first order blazed grating emission spectrum is on the top to the right side. The processed spectrum band is below the blazed grating spectrum.
KUV18217+6419 image was taken during the Pine Mountain Observatory (PMO) Workshop August 5-8, 2010, by the below spectroscopy team:
|
|
|
Spectrum KUV18217_6419c.zip Fit Image which can be viewed with ImageJ The Rainbow Optics diffraction grating filter is blazed for the first order on the right of the zero order image. Look at the two brighest stars to see their bright first order spectrum on the right side. Next, look at the left side of these bright stars for their fainter unblazed first order. The spectrum closest to the zero order image is the short wavelength of the spectrum. The spectrum farther away from the zero order image is the longer wavelength of the spectrum. The above animation image shows three frames:
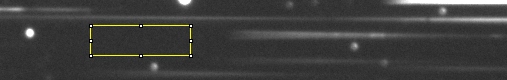
Spectrum Selection |
|
|
|
Spectrum 3-D Surface Plot 
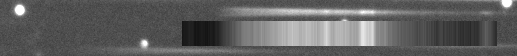
Spectrum Band
Spectrum Chart 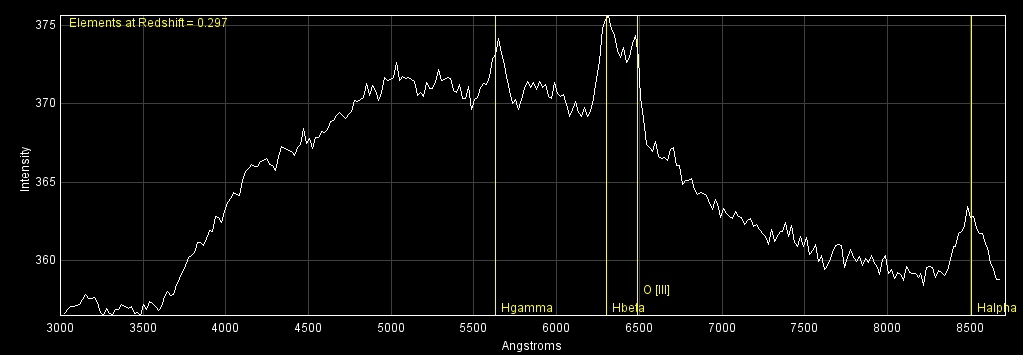
Spectrum Calibration
Signal to Noise Ratio
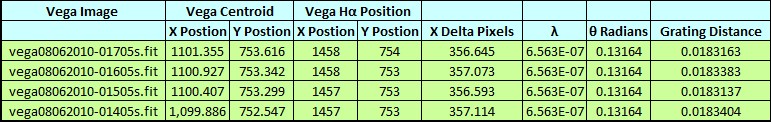
The following measurements of the above yellow selection box are found at the bottom of the spectrum log below.
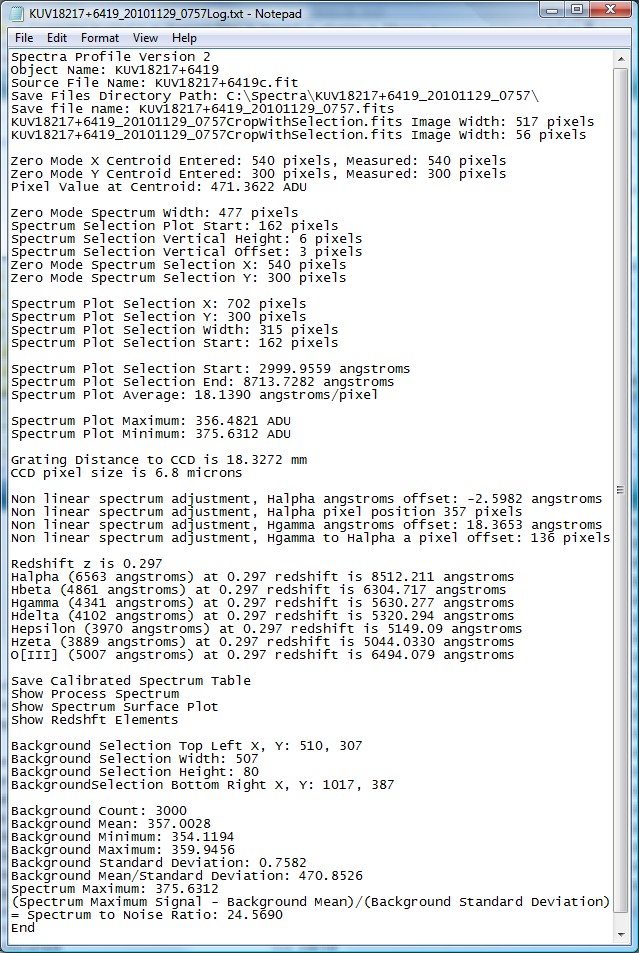
ImageJ Macro Spectrum Log
Redshift Measurement Tables Details of the Emission Lines Redshift Analysis Table
|
||
|
Emission Lines Redshift Analysis Table 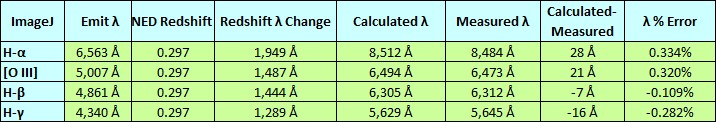
Redshift Analysis Table 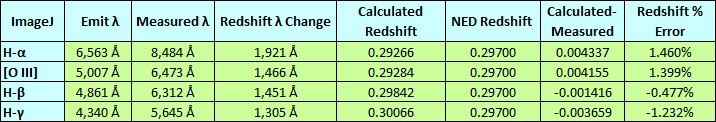
The average of the measured H-alpha, O[III], H-beta and H-gamma redshifts is z=0.29615 which is 0.29%: lower than z=0.297000 in the NASA-IPAC Extragalactic database. Analysis with the Redshift The following analysis uses KUV18217+6419 redshift (z=0.29615).
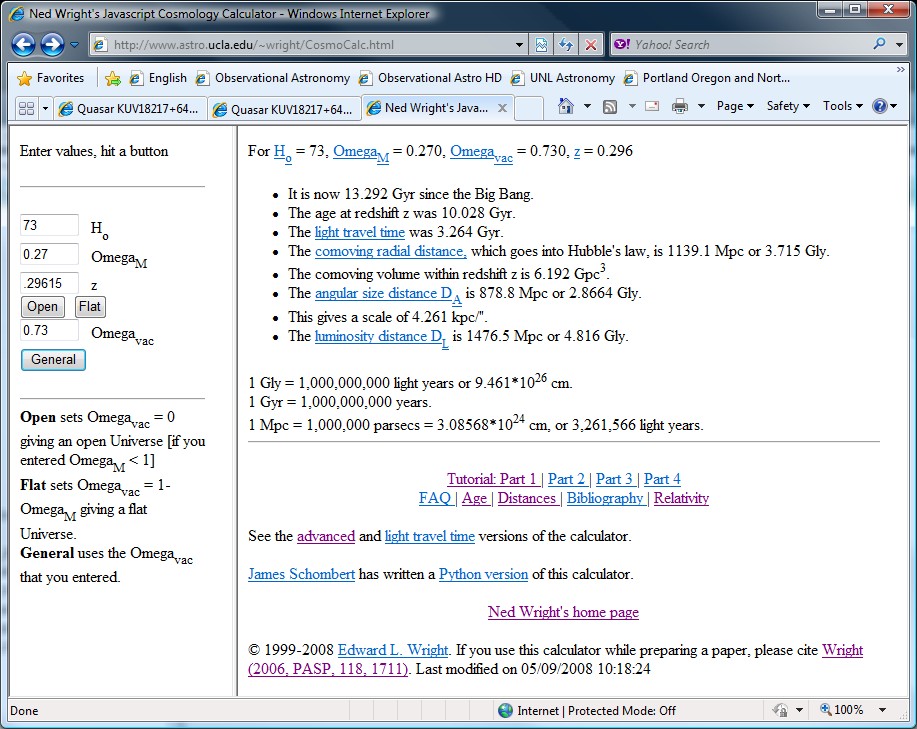
Ned Wright's Cosmology Calculator, Wright (2006, PASP, 118, 1711)
Monitor Test PatternThe following test pattern is to help you adjust your monitor to best view the CCD astro images. The test pattern is used for adjusting monitor brightness, and contrast. Adjust monitor brightness and contrast to see all 16 gray scale levels. The most important adjustment when viewing astro images is to see the differences in all of the black bands. |