|
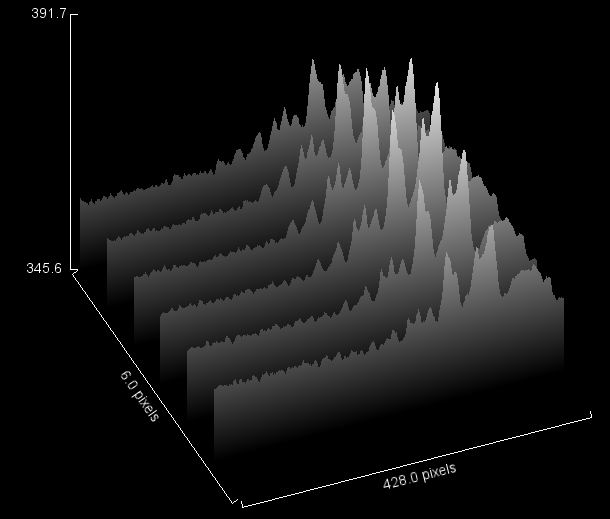
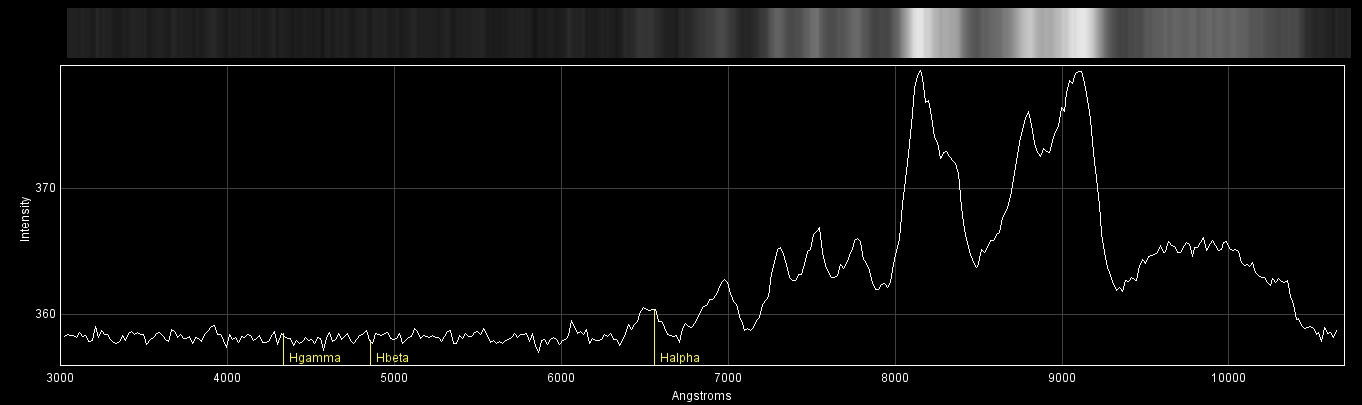
Spectrum Chart
- The above chart is the average of the vertical pixels in the selection area of the spectrum.
- Spectrum Plot Selection Start: 2999.9559 angstroms
- Spectrum Plot Selection End: 10692.2873 angstroms
- Spectrum Plot Average: 17.9727 angstroms/CCD pixel
- The vertical axis is the intensity values (average of the vertical pixels in the selection) of the spectrum image.
- Three reference yellow line markers were added.
Spectrum Calibration
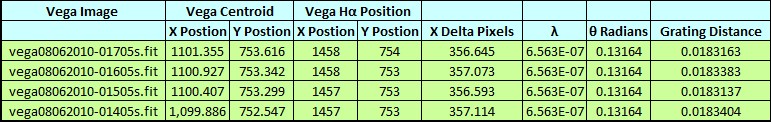
- Vega H-alpha absorption line was used to calibrate the x axis in
angstroms by measuring the distance of the grating to CCD.
- Vega H-alpha absorption line distance was measured from the centroid of the spectral order zero.
- The below table shows the four images used and the calculated grating distance between the grating and the CCD.
- The grating distance mean is 18.3272 mm with a standard deviation of 0.01414 mm.
- The first angstrom calibration equation is Ĺ =SIN (ATAN (0.0000068* pixel distance /.01832719265135))*0.000005*10000000000
- Ĺ is light wavelength measured in angstroms.
- 0.0000068 m is QSI532ws pixel size (6.8 microns).
- Pixel distance is the horizontal pixel distance from the centroid of spectral order zero.
- .01832719265135 is the distance of the grating to CCD (18.3272 mm).
- 0.000005 m is the distance between the Rainbow Optics grating filter lines (200 lines/mm grating).
- 10000000000 converts the wavelength from meters to angstroms.
- See the second column Angstroms in
V_IY_Dra_20101205_1010AllTable.txt
- The second angstrom calibration equation is a linear x=Ay+B to align the H-delta angstrom value and H-alpha angstrom value to the absorption lines of image vega08062010-01605s. See the third column Angstroms Adjust in
V_IY_Dra_20101205_1010AllTable.txt

Signal to Noise Ratio
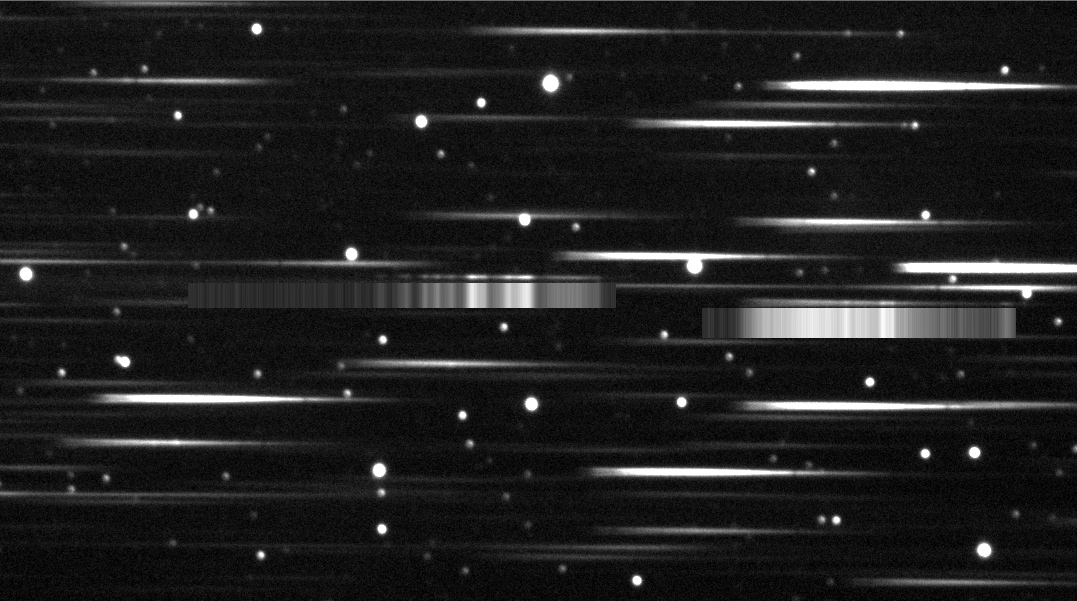
The background measurements are of the above yellow selection box.
- The image extreme stretch is used to check for faint stars or spectrum that could affect the below measurements.
- Background Mean: 358.0155
- Background Minimum: 355.4602
- Background Maximum: 360.6219
- Background Standard Deviation: 0.8454
- Background Mean/Standard Deviation: 423.4909
- Spectrum Maximum: 379.3303
- (Spectrum Maximum Signal - Background Mean)/(Background Standard Deviation) = Spectrum to Noise Ratio: 25.2130
ImageJ Macro Spectrum Log

The following test pattern is to help you adjust your monitor to best view the CCD astro images.
The test pattern is used for adjusting monitor brightness, and contrast.
Adjust monitor brightness and contrast to see all 16 gray scale levels.
The most important adjustment when viewing astro images is to see the differences in all of the black bands.

|