<<PREVIOUS - HOME - CONTENTS - NEXT>>
SPECTROSCOPY INDEX - New

Quasar 3C 273 Spectrum and Measuring 3C 273 Redshift


Quasar 3C 273 Spectrum

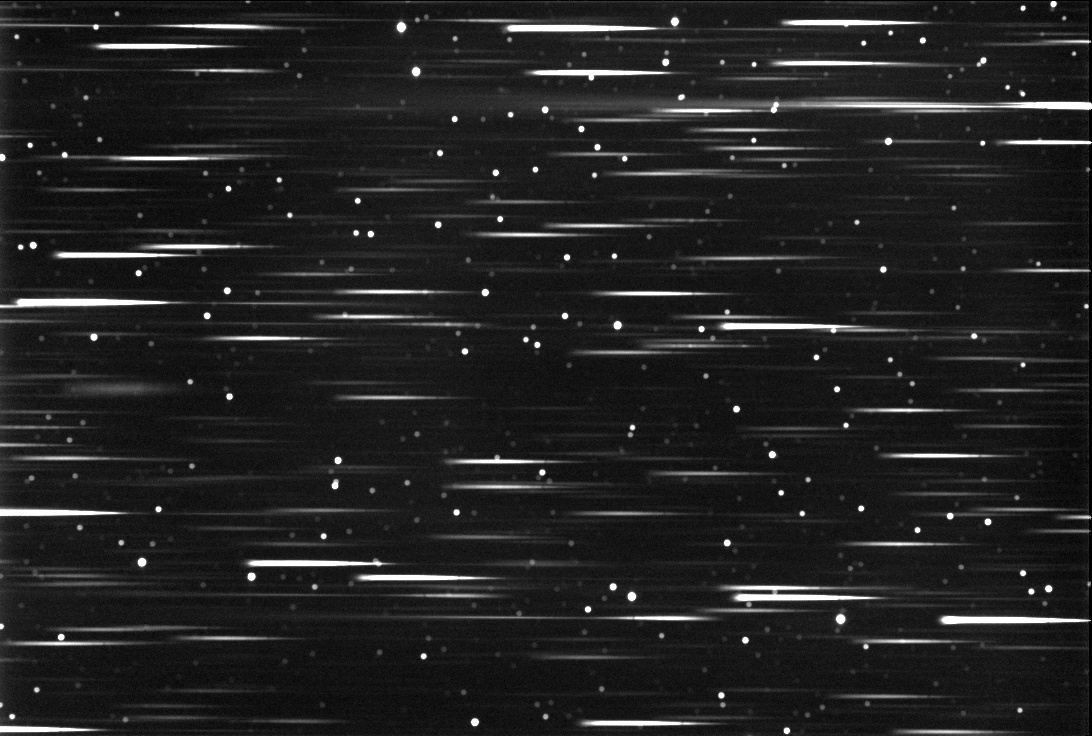
3C 273 is in the center of this full FOV image at half scale.

Quasar 3C 273 Spectrum

3C 273 cropped image at full scale.

Summary
 
Quasar 3C 273 is the first quasar redshift spectrum to be identified by Dr. Maarten Schmidt in 1963 with the Hale 200 inch (5.08 m) reflector at the Palomar Observatory. 3C_273 light travel-time is 1.98 Gyr based on Ho = 73.00 km/sec/Mpc, Omegamatter = 0.27, Omegavacuum = 0.73.

The average of the measured H-alpha and H-beta redshifts is z=.1608 which is 1.5%: higher than z=0.158339 in the NASA/IPAC Extragalactic database. It is amazing that amateur astronomers with small optics (127 mm refractor) in light polluted skies can duplicate this historical observation and analysis that was first done by Dr. Maarten Schmidt in 1963 with a 200 inch (5.08 m) reflector.
 

Seeing the H-alpha and H-beta Emisson Lines at the Telescope

Cartes du Ciel 2.76c and MaxIm DL V5.07

  • The above screen capture at the telescope is MaxIm DL V5.07 on the bottom of the screen showing one 300 second exposure of quasar 3C 273.
  • The mouse pointer shows 3C 273 at spectral order zero.
  • 3C 273 spectrum is to the right of 3C 273 spectral order zero.
  • Notice the three lumps in the 3C 273 spectrum that is visible in this single 300 second exposure.
  • In the top Cartes du Ciel 2.76c star chart quasar 3C 273 is circled.
  • The stars are out of focus because the focus was optmized for H-beta to H-alpha spectrum.
  • North is approximately 210 degrees clock wise from straight up.

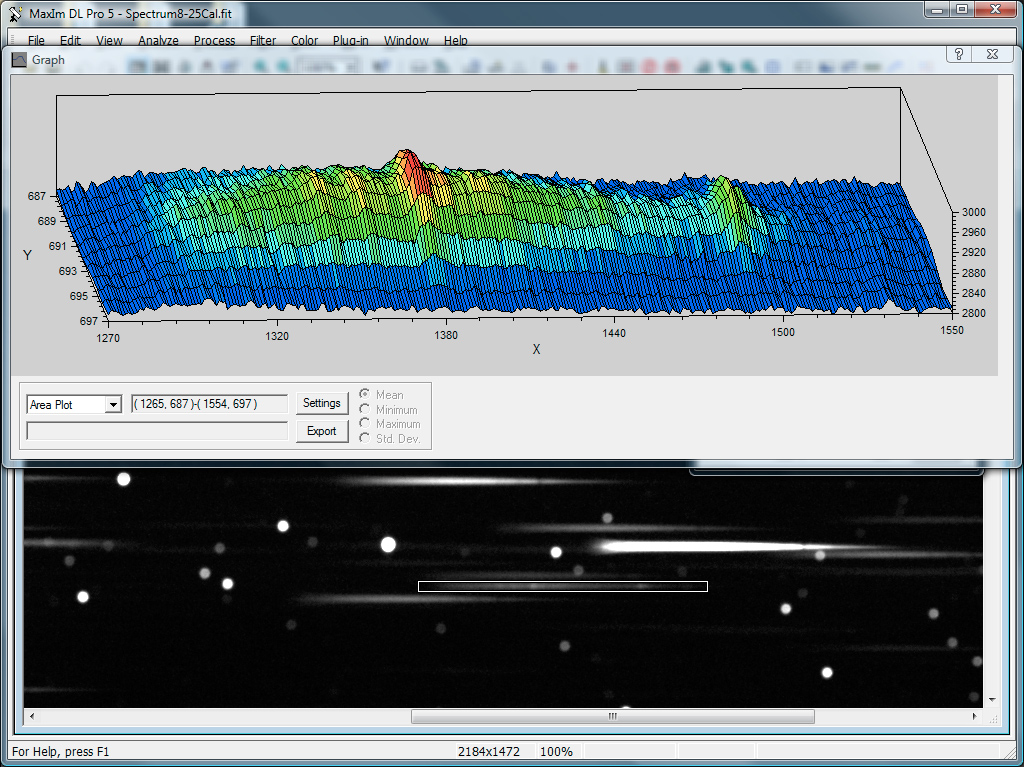
Seeing the 3-D H-alpha and H-beta Emisson Lines in the Processed Image
 

MaxIm DL V5.07

Signal to Noise of the background

  • The graph red peak is H-beta and [O III] emission lines merged together and the far right green peek is H-alpha line.
  • Image scale of 2.12 arcsec/pix.
  • The spectrum is on the right of the quasar 3C 273 and stars.
  • 55 images were taken.
    • First image started when 3C 273 cleared the trees in the southwest.
    • Last image was about 1 hour past the merdian which is the limit for this telescope configuration on the GEM mount.
  • 16 images were selected to be stacked because the sky background was changing too much from the Portland sky glow in the other images.
    • AIP4WIN V2.3.0 Series Analysis each image.
    • 3C273SeriesAnalysis.txt was used to select 3C273-008R200.fit to 3C273-025R200.fit images to be stacked based on their MedianPV being in the 2,700s range.
    • The MedianPV for the last image 3C273-055R200.fit was 4850 and is an indication of the increase in sky glow from Portland, OR.
  • Exposure: 16 images x 300 seconds per image.
    • Darks: 64 x 300 seconds per dark frame.
    • Flats: 64 x 5 seconds per flat frame.
    • Darks for Flats: 66 x 5 seconds per dark frame.
    • CCD-TEMP for all images, flats and darks: -25°C.
  • Tracking, no guiding.
  • Signal to Noise: Measure Signal to Noise of the background below 3C273 area with no stars.
    • Signal to Noise = background average 2806.478/background Std Dev 4.478 = 626.725.

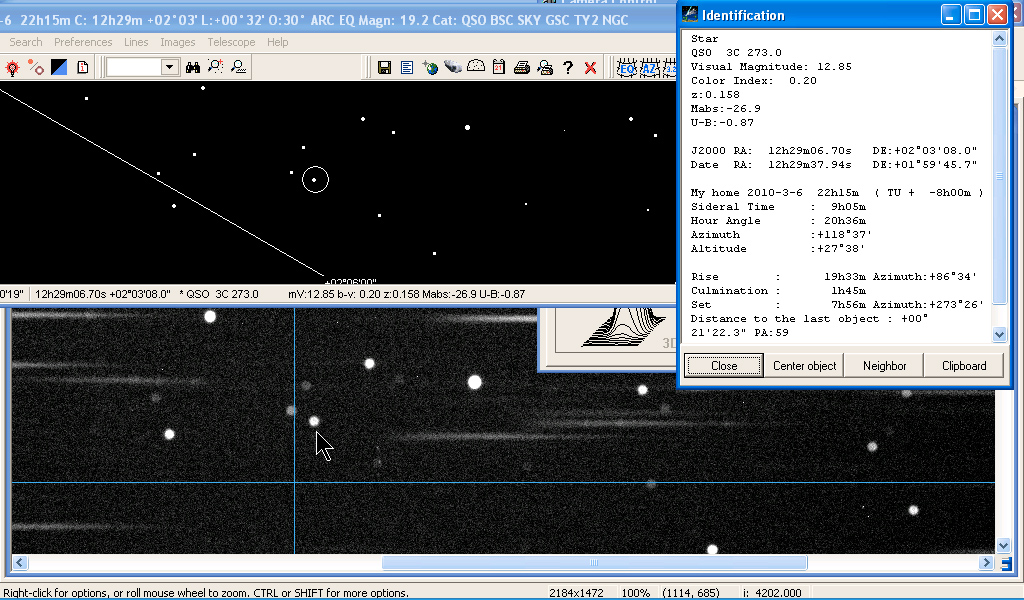
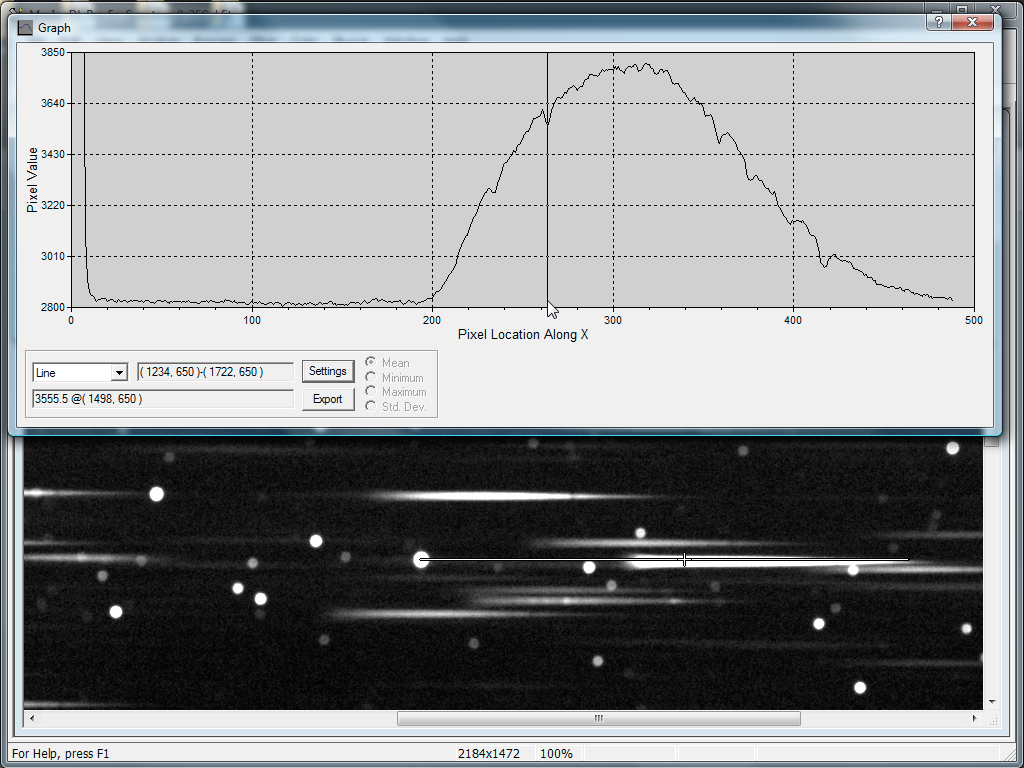
Star BD+02 2547 next to 3C 273 in Same Image is Used for Spectrum Calibration
 

Star H-beta absorption line is used for spectrum calibration

A simple spectrum calibration was done with the H-beta absorption line of the following nearby star.

  • Star BD+02 2547
  • Visual magnitude: 10.25
  • Color index: 0.31
  • Spectral class: F5

This star is above and to the right of 3C273 in the above screen capture. The calibration is 18.553 Å/pixel at H-beta absorption line. Also, based on this calibration the Rainbow Optics Visual, Photo and CCD Star Spectroscope mounted in the QSI 532ws-M1 filter wheel is at a distance of 18.24mm from the CCD.

3C 273 Spectrum Chart with Redsift Emission Line Markers

E3C 273 Spectrum

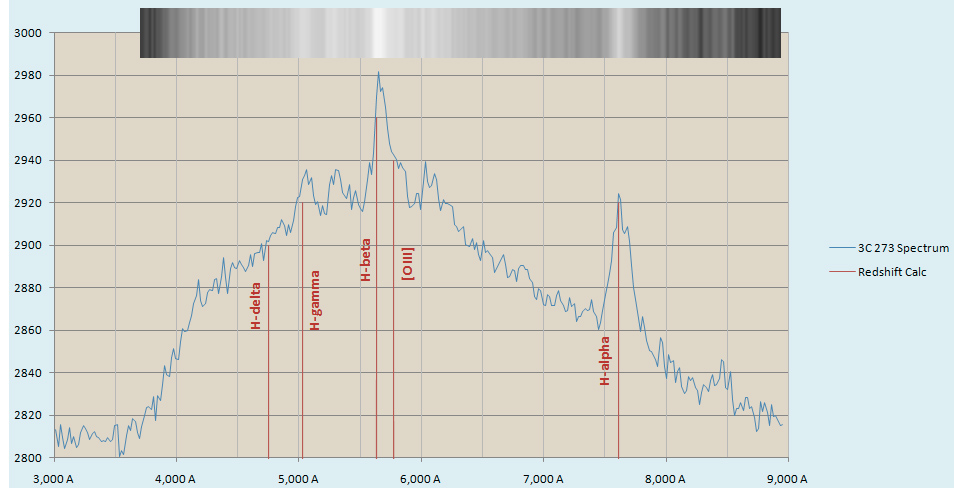
The above chart is the measured 3C273 spectrum with redsift emission line markers. The H-beta pixel distance and 18.553 Å/pixel from the above star BD+02 2547 were used to calibrate the x axis in angstroms. Five red emission reference line markers were added to show the observed redshift (z=.158339) of the elements in the below table. The vertical axis is the intensity values of the spectrum image.

The spectrum bump at 8,400 Å to 8,500 Å is a spectral order zero field star (magnitude 16.68 red) SDSS J123000.57+015343.6 (summary data)

The 3C273 observed H-alpha is at 7602 Å which is above the normal human visible light vision range of 3800 Å to 7400 Å.


3C 273 Spectrum Calibration Steps
Diffraction Limited MaxIm DL V5.07 and Microsoft Excel 2007 were used in creating the 3C 273 spectrum chart. Below is the outline of steps used to create the spectrum chart.

  • Use MaxIm DL v5.07 to measure the centroid of star BD+02 2547.
  • Use MaxIm DL v5.07 to draw a line graph from the centroid of star BD+02 2547 through it's spectrum.
  • Use MaxIm DL v5.07 graph cursor to locate the pixel distance of H-beta (262 pixels) which is shown in the above star BD+02 2547 screen capture.
  • Divide H-beta wavelength 4861 Å by 262 which gives 18.553 Å/pixel.
  • Use grating equation to calculate the angle.
    Grating Equation
    • m = 1 (spectral order 1).
    • Wavelength = 486.1 nm (H-beta emit wavelength).
    • Grating d = 0.000005 m (200 lines/mm grating = 0.000005 m between lines).
    • Therefore angle = 0.097373805 radians for H-beta at rest.
  • Use tan of the angle to calculate the distance from grating to CCD.
    • Tan (0.097373805 radians) = (262 pixels * QSI532 pixel size of 6.8µm)/(distance of grating to CCD).
      • 0.097373805 radians for H-beta at rest.
      • 262 pixels = number of pixels from the center of star BD+02 2547 spectral order zero.
    • Therefore distance of the grating to CCD = 18.24mm which is close to the QSI specification of the filter seat being 17.53mm from the CCD.
  • Use MaxIm DL v5.07 to draw a line profile of 3C273 spectrum and then export the line profile as CSV to be read by Excel.
  • Use Excel to convert 3C 273 line profile pixel distance to angstroms.
    • Å =SIN (ATAN (0.0000068* pixel distance /0.018238638252))*0.000005*10000000000
      • 0.0000068 m is QSI532 pixel size.
      • Pixel distance is the horizontal pixel distance from the center of 3C 273 spectral order zero.
      • 0.018238638252 m is the distance of the grating to CCD.
      • 0.000005 m is the distance between grating lines (200 lines/mm grating).
      • 10000000000 converts the value to angstroms.
  • Use Excel to plot 3C 273 spectrum intensity with angstroms scale and add redshift emission line markers.
  • Excel 3C 273 spectrum PDF (3C273SpectChartWeb.pdf )


3C 273 Quasar Redshift Emission Lines Table

The redshft emission line markers in the above 3C 273 spectrum chart are based on the below redshift (z=0.158339) table.  

3C 273 Redshift
z=0.158339

Redshift

Elements

Emit Wavelength

Redshift Change
in Wavelength

Observed Wavelength

H-alpha

6563 Å

1039 Å

7602 Å

[O III]

5007 Å

793 Å

5800 Å

H-beta

4861 Å

770 Å

5631 Å

H-gamma

4340 Å

687 Å

5027 Å

H-delta

4102 Å

650 Å

4752 Å


Redsift Analysis Based on the above 3C 273 Spectrum Chart

Elements

Emit Wavelength

Observed Wavelength at Peak

Observed Redshift z

Redshift Error
z=0.158339

Signal/Noise Ratio at Peak

H-alpha

6563 Å

7609 Å

0.1594

0.6909%

26.28

H-beta

4861 Å

5649 Å

0.1622

2.421%

39.14

The average of the measured H-alpha and H-beta redshifts is z=.1608
which is 1.5%: higher than z=0.158339 in the NASA/IPAC Extragalactic database.

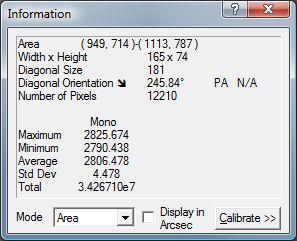
Note: Signal/Noise Ratio at Peak = (Peak-Background Ave)/(Background Std Dev)
H-beta Signal/Noise Ratio at Peak = (2981.76-2806.47)/(4.478) = 39.14 S/N


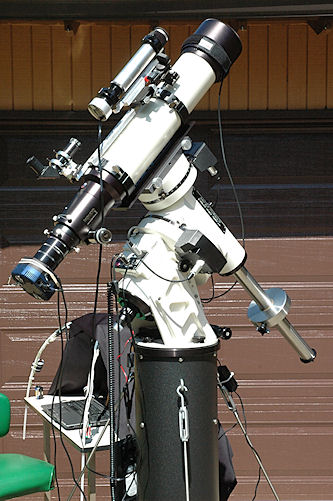
Observing Information QSI 532ws-M1 CCD Camera, Tele Vue NP127is Refractor and Astro-Physics 1200GTO German Equatorial Mount

  • OBS-Location: Camas, WA USA, 16.6 miles East-North-East from the center of Portland, OR.
  • Image taken through the Portland, OR USA sky glow.
  • DATE-Local = March 6, 2009 at 11:12 pm PDT to March 7 4:20 am PDT.

Imaging Equipment

Imaging Processing

  • AIP4WIN V2.3.0 Series Analysis each image.
  • Diffraction Limited MaxIm DL V5.07.
    • Create master dark with SD Mask combine.
    • Create master flat dark with SD Mask combine.
    • Create master flat with SD Mask combine.
    • Calibrate images with master dark and master flat.
    • Save as FIT.


Links


Monitor Test Pattern

The following test pattern is to help you adjust your monitor to best view the CCD astro images. The test pattern is used for adjusting monitor brightness, and contrast. Adjust monitor brightness and contrast to see all 16 gray scale levels. The most important adjustment when viewing astro images is to see the differences in all of the black bands.