Supernovae SN 2011fe Spectrum
Introduction
The above spectrum image is a positive and negative image of
supernovae
SN 2011fe in
M101 (NED). The images are 100 percent image scale and are cropped from the
full size image. We see the light that arrived from the supernovae 16 million light years after it occurred.
The round
spectral order zero is on the left side of the image and its first order
blazed grating
spectrum is on the right side.
It is standard to show the spectrum with the short wavelengths on the left and the long wavelengths on the right.
Therefore, north is at the bottom edge of the above images.

Locating Supernovae SN 2011fe

- The screen capture is a
SDSS image before the supernovae at R.A. = 14:03:05.80, Decl. = +54:16:25.3.
- Click on screen capture to go to SDSS Navigate Tool.
- The left side screen capture is a zoomed out SDSS image before the supernovae.
- Click on screen capture to go to SDSS Navigate Tool and then zoom out twice.
- The right side image is a 20 minute image with Vancouver, WA USA light pollution.
- Click on image to see full size image.
- The faint objects in this image include:
CCD Camera Rotation
Five minutes images were taken of the supernovae to check the areas to the left and to the right of supernovae for no stars, M101 HII regions, etc.
Objects to the left and right of suppernovea will cause inaccuracies in the supernovae spectrum analysis.

- The above image is an example of poor camera alignment with stars on boths sides of the supernovae.
- Also, there is a bright M101 Hα region to the far left side of the supernovae.
- There is not a clear area to the left and right of supernovae.
- Stars and HII regions of M101 will cause problems with the supernovae spectrum analysis.
- North is at the bottom of the image.

- The above image is a good camera alignment with clear areas to the left and right of supernovae for its spectrum.
- North is at the bottom of the image.
3-D Spectrum Area Plot


- Area plot aspect ratio is not square.
- MaxIm DL area plot.

Spectrum Chart (Not calibrated for the instrument response)

References
- Figure 6: Early spectral evolution of type Ia.
- D. Branch et al. Comparative Direct Analysis of Spectra of Type Ia Supernovae. I. SN 1994D.
PASP, 117, 545, 2005.
[ arXiv ]
- D. Branch et al. Comparative Direct Analysis of Type Ia Supernova Spectra. II. Maximum Light
PASP, 118, 560, 2006.
[ arXiv ]
- D. Branch et al. Comparative Direct Analysis of Type Ia Supernova Spectra. III. Premaximum
PASP, 119, 709, 2007.
[ arXiv ]
- D. Branch et al. Comparative Direct Analysis of Type Ia Supernova Spectra. IV. Postmaximum.
PASP, 120:135-149, February 2008.
[ arXiv ]
- D. Branch et al.
Optical Spectra of the Type Ia Supernova 1998aq.
AJ, 126:1489-1498, September 2003.
[ arXiv ]
Spectrum Chart Wavelength Calibration
- The first choice in calibrating the x axis is to find a spectral type A star (zero order and spectrum) with Balmer absorption lines in the supernovae image. No bright spectral type A stas were found in the image.
- Upon analyzing the image there are several M101 HII regions
(Spectrophotometry of H II regions in the spiral galaxy M101 by K. E. SEDWICK AND L. H. ALLER)
that show strong emission bands in Hα 6563 Å, Hβ 4861 Å OIII 4959 Å and OIII 5007 Å.
- The
NGC 5461 (NED) HII spectrum was used to determine the x axis wavelength in angstroms calibration.
- The below screen capture show the NGC 5461 HII region spectrum and its pixels values (north is at the bottom of the image).
- At the top of the screen capture is the supernovae.


- NGC 5461 zero order is at 13.2 pixels.
- NGC 5461 Hβ 4861 Å, OIII 4959 Å and OIII 5007 Å weighted mean is 4971.115 Å (see (Spectrophotometry of H II regions in the spiral galaxy M101 by K. E. SEDWICK AND L. H. ALLER)) at 282.5 pixels.
- NGC 5461 Hα 6563 is at 370.2 pixels.
- Therefore, there is 18.1485 Å/pixel between Hα 6563 Å and Hβ 4861 Å, OIII 4959 Å and OIII 5007 Å weight mean (4971.115 Å).
- M101 supernovae x axis angstroms calibration.
- Supernovae zero order pixel location is 13.4 pixel. 0.2 pixel more than the NGC 5461 zero order.
- The Hβ 4861 Å, OIII 4959 Å and OIII 5007 Å weight mean (4971.115 Å) at 282.5 pixels is adjusted from 282.5 to 282.7 pixels.
- One point wavelength calibration with 18.1485 Å/pixel is used with 282.7 pixels at 4971.115 Å as the reference point.
- The vertical axis is the spectrum intensity that has not been calibrated for the instrument response curve.
- RSpec Data files NGC5461.zip
- Raw data: ProfileNGC5461Box1281x712y1685x732y.dat
- NGC5461.dat
- NGC5461.ini
- RSpec Data files SN2011fe.zip
- Raw data: ProfileSN2011fe.dat
- SN2011feCal.dat
- SN2011feCal.ini
- RSpec spectrum chart.
Spectrum Chart Wavelength Comparsion

The above spectrum comparsion provides feedback on how well using NGC 5461 in the image worked for spectrum wavelength calibration.
- The white spectrum with red data points is the spectrum calibrated from NGC 5461 HII region in the image. The vertical axis is the spectrum intensity that has not been calibrated for the instrument response curve.
- The blue spectrurm is
Francois Teyssier's
spectrum taken on 23.785/09/2011 with a LISA + SC25cm + Starlight SXV-H9 and has been calibrated for the instrument response. Data (sn2011fe_20110924_785_teyssier.dat) is at
SN 2011fe in Messier 101 (NGC 5457)
by ARAS. The vertical axis is the spectrum intensity that has been calibrated for the instrument response curve.
- RSpec spectrum chart.
Signal to Noise Ratio

The following MaxIm DL background measurements are of the above white selection box that is between the zero order of the supernovae and its spectrum.
- Background Average: 929.956
- This high background level is from Portland, OR and Vancouver, WA USA light pollution.
- Background Standard Deviation: 4.249
- Background Average/Standard Deviation: 218.86 background to noise ratio.
- Spectrum Maximum: 1868.581
- (Spectrum Maximum Signal - Background Average)/(Background Standard Deviation) = Spectrum Maximum to Background Noise Ratio: 220.90
Imaging Processing
- AIP4WIN V2.3.0 Series Analysis on all images and calibration frames.
- Diffraction Limited MaxIm DL V5.07.
- Create master dark with SD Mask combine (3 passes and 0.50 sigma factor) of 54 darks (5 minutes each at 18°C).
- Create master flat from dawn light.
- SD Mask combine (3 passes and 0.50 sigma factor) 93 0.3 second flats darks.
- Dark calibrate each flat.
- SD Mask combine (3 passes and 0.50 sigma factor) 128 0.3 second flats with linear normalization, area 50%, ignore pixels over 65,000.
- Calibrate the 12 supernovae images (5 minutes each at 18°C) with master dark and master flat.
- SD Mask combine (3 passes and 0.50 sigma factor) the 12 images with linear normalization, area 50%, ignore pixels over 65,000.
- Save as FIT.
- Crop and save as FIT and JPG (image at top of this web page).
- Field Tested Software RSpec V1.3.0 (Build: 39).
Observing Information
- OBS-Location: Home on the driveway at Camas, WA USA, 16.6 miles East-North-East from the center of Portland, OR and east of Vancouver, WA.
- Image taken through the Portland, OR and Vancouver, WA. USA sky glow.
- 12 by 5 minutes images stacked (60 mintues total).
- Frist image taken at 9-23-2011 9:49 pm PDT ( 9-24-2011 4:49 UTC)
- DD-MM-YYYY 24.201-09-2011 UTC
- Last image taken at 9-23-2011 10:54 pm PDT ( 9-24-2011 5:28 UTC)
- DD-MM-YYYY 24.228-09-2011 UTC
- Sunset at 7:06 pm PDT.
- Twilight ends 8:46 pm PDT.
- Images for testing clear path for supernovae spectrum 9:07 to 9:28 pm PDT.
- Spectrum focusing on Vega 9:30 to 9:42 pm PDT.
- Supernovae spectrum imaging started at 9:49 pm PDT. First image was Azm: 321°26'10" Alt: +24°22'23", Air mass: 2.24 (6 images).
- 85-Eta Ursae Majoris spectrum imaging 10:18 to 10:21 pm PDT. Imaging was stopped when 85-Eta Ursae Major went behind the trees.
- Second group of supernovae spectrum image was from 10:28 to 10:54 pm PDT.
Last image was Azm: 328°00'42" Alt: +17°07'29", Air mass: 3.38 (6 images). Imaging was stopped when the supernovae went behind the trees.
- Vega spectrum imaging 2:21 to 2:29 am PDT. Imaging was stopped when the Vega went behind the trees.
Imaging Equipment
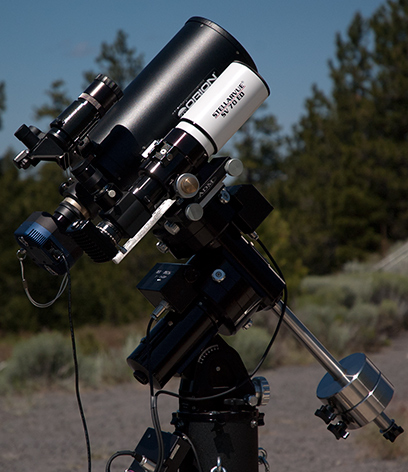
Rainbow Optics 200 lines/mm diffraction grating spectroscope was used for a low resolution spectrum of the supernovae. The right side photo of the telescope was taken at Pine Mountain Observatory.
- Camera: QSI 532ws-M1 CCD camera.
- Diffraction grating: Rainbow Optics Visual, Photo and CCD Star Spectroscope filter mounted in the QSI532 filter wheel.
- Edmund Optics T-Mount Extension Tube 20mm (NT53-231).
- Focal Reducer/Corrector: Orion Argonaut™ 1800mm to 1440mm, f/12 to f/9.6, 0.8X.
- Telescope: Orion Argonaut™ 150mm Maksutov-Cassegrain telescope,
f/12 focal ratio, 1800mm focal length.
- Finder: Orion Black 9x50 Right-Angle Correct-Image Finder Scope.
- 1X Finder: Orion EZ Finder Deluxe Telescope Reflex Sight.
- Guide camera: Meade Deep Sky Imager PRO.
- Guide telescope: Stellarvue SV 70ED.
- Mount: Astro-Physics Mach1GTO German Equatorial Mount
with GTOCP3 Control Box.
Supernovae SN 2011fe

The following test pattern is to help you adjust your monitor to best view the CCD astro images.
The test pattern is used for adjusting monitor brightness, and contrast.
Adjust monitor brightness and contrast to see all 16 gray scale levels.
The most important adjustment when viewing astro images is to see the differences in all of the black bands.

|


