<<PREVIOUS -
HOME -
CONTENTS -
NEXT>>
SPECTROSCOPY INDEX -
![]()
<<PREVIOUS -
HOME -
CONTENTS -
NEXT>>
SPECTROSCOPY INDEX -
![]()
|
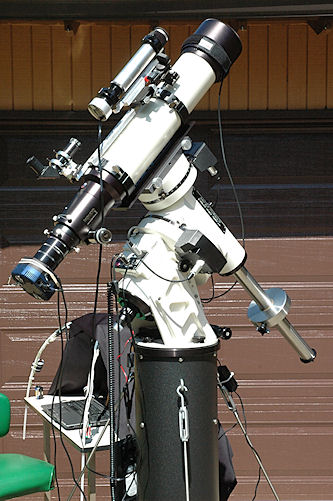
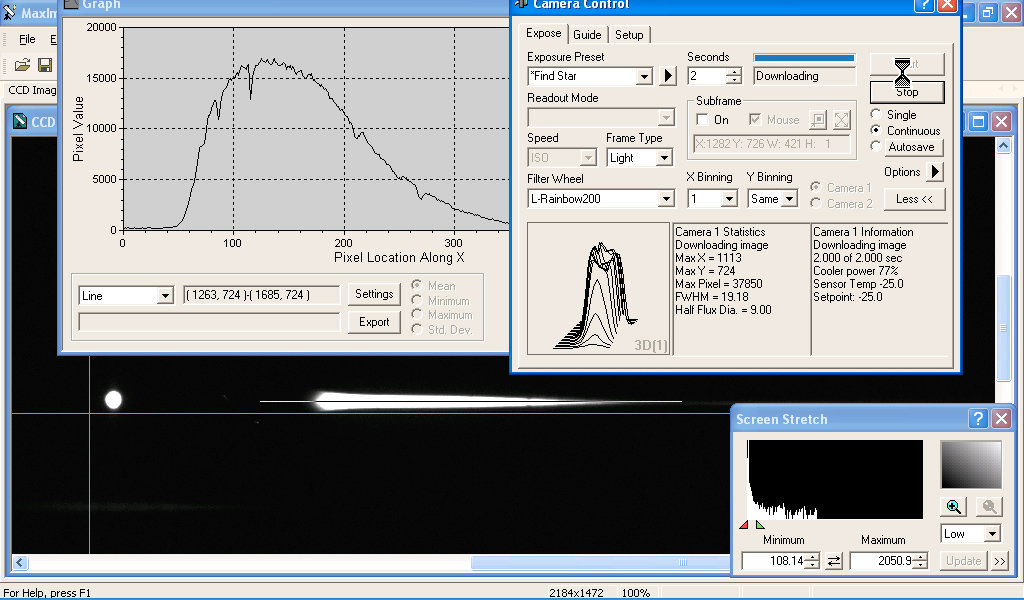
Denebola is spectal class A3V and it has strong Balmer absorption lines which help in the focusing. Also, Denebola rose above the trees before the primary imaging object, quasar 3C 273 rose above the trees. MaxIm DL V5.07 controls the QSI 532ws-M1 CCD camera on the Tele Vue NP127is refractor. MaxIm DL graph window provides an easy way to see the spectrum at the telescope as soon as the image is downloaded from the camera to the netbook computer. In the screen captures Denebola is in the bottom left corner (next to the blue cross hairs) and it’s spectrum is to the right with the MaxIm graph window line placed on the vertical center of the spectrum. The below sequence of screen captures taken at the telescope show the effects of changing the focus from the short wavelengths to longer wavelengths. Look at the below screen captures and see the following changes as a result of the focus moving to the longer wavelengths:
For imaging the 3C 273 spectrum the focus was set for H-beta to H-alpha spectrum range because the 3C 273 redshift H-beta would be in this range. |
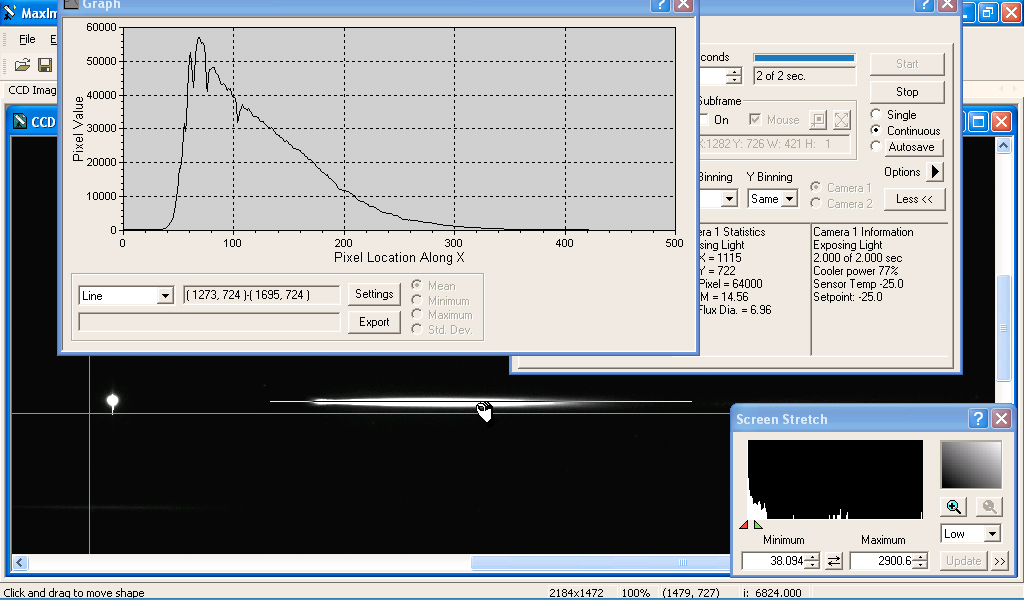
In the above screen capture the spectrum focus is between H-delta and H-gamma & intensity peak is between H-delta and H-gamma.
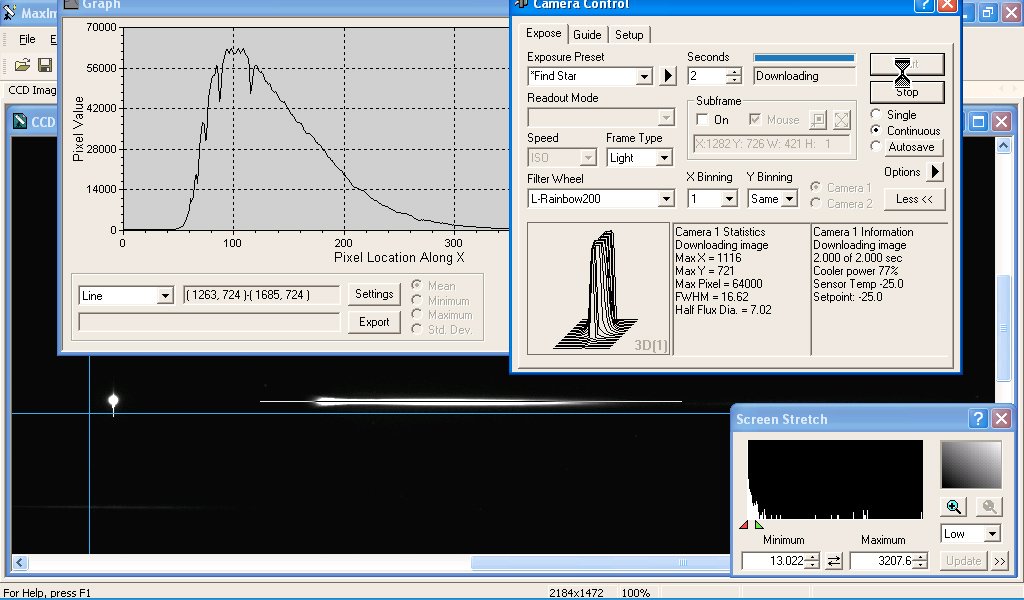
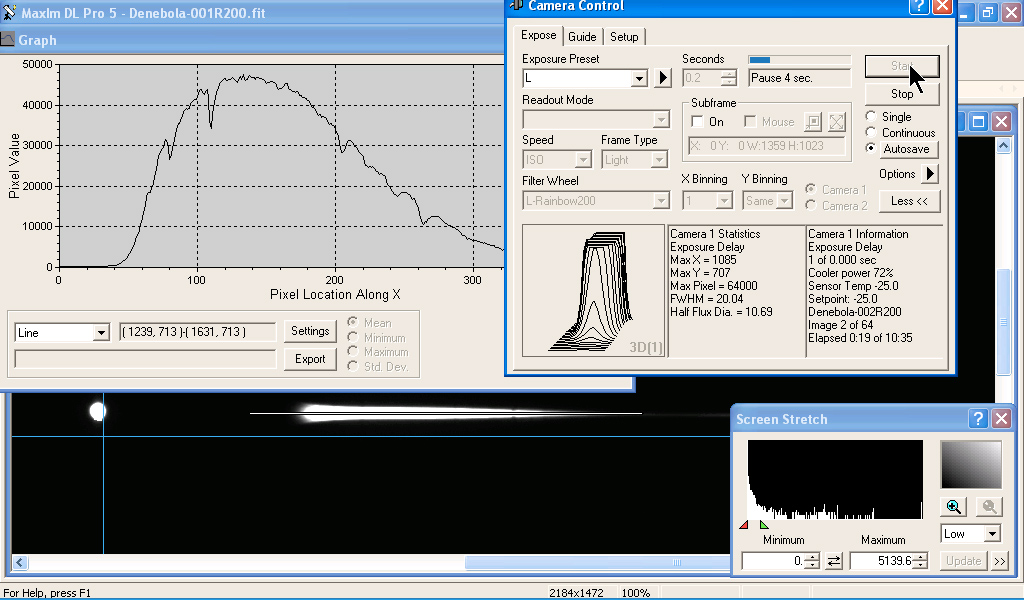
In the above screen capture the spectrum focus is between H-gamma and H-beta & intensity peak is between H-gamma and H-beta.
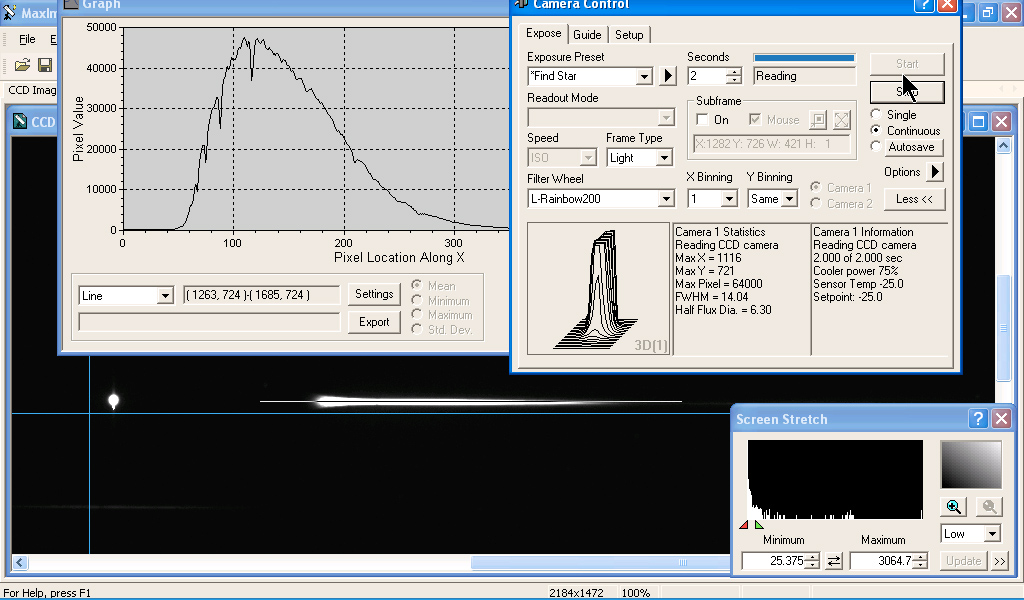
In the above screen capture the spectrum focus is at H-beta & intensity peak is at H-beta.
In the above screen capture the spectrum focus is just beyond H-beta towards H-alpha & intensity peak is between H-beta and H-alpha.
In the above screen capture the spectrum focus is between H-beta and H-alpha & intensity peak is between H-beta and H-alpha.
![]()
The following test pattern is to help you adjust your monitor to best view the CCD astro images. The test pattern is used for adjusting monitor brightness, and contrast. Adjust monitor brightness and contrast to see all 16 gray scale levels. The most important adjustment when viewing astro images is to see the differences in all of the black bands.