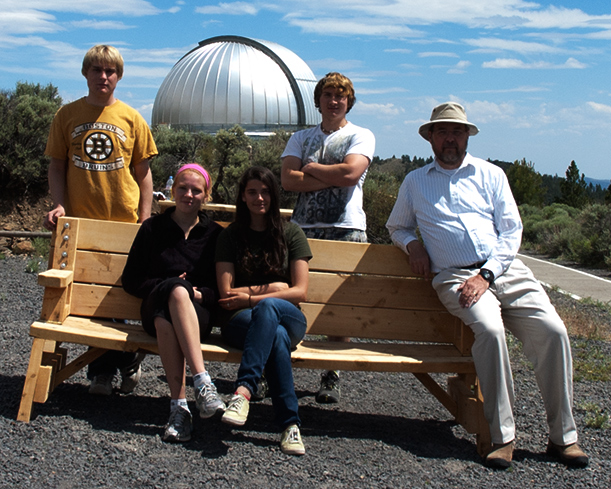
Spectroscopy Team
|
The activities below were done by the spectroscopy team:
- Claire Prihoda, Lincoln High School, Portland
- Anna Cramer, Lincoln High School, Portland
- Dashton Peccia, St. Mary's High School, Medford
- Preston Carney, St. Mary's High School, Medford
- David Haworth, Team Leader
|
What We Learned:
How to handle and recognize a variety of equipment-telescope, camera, spectroscopes (made our own), software, inherent flaws in equipment
We learned more about the sky which surrounds us through being able to identify constellations and learning proper terminology
We learned what the electromagnetic spectrum is and how it can help us to analyze stars. The spectrum provides information regarding elements in the atmospheres of stars through absorption, emission, and continuous spectra.
We did several labs through the week, first analyzing the spectra of known gasses using glasses and spectroscopes. Then we were able to identify gasses by their unique spectra.
We used this new knowledge of the electromagnetic spectrum to further analyze our data collected Sunday night and identify the elements through the absorption lines in their spectra.
Sunday August 15, 2012
Objectives
- Set up equipment
- Finalize spectroscropy team members
- Spectroscropy team training on running the equipment
- A, K, etc. star spectrums
- M57 spectrum
14:00 to 17:00 Workshop Setup
- Arrive and check in
- Setup mount, telescope, spectrographs, computers, tables, chairs, etc.
- Setup a place to sleep
17:00 to 19:00 Workshop group welcome meeting
- Welcome to workshop and introductions
- Finalize spectroscropy team members and other workshop teams
21:00 to 22:00 Final equipment setup and testing for imaging
- Polar alignment
- Star testing on Vega
- Equipment training
- Mount control station
- Camera control station
- Documentation station
21:58 to 3:20 Spectroscopy Imaging Notes
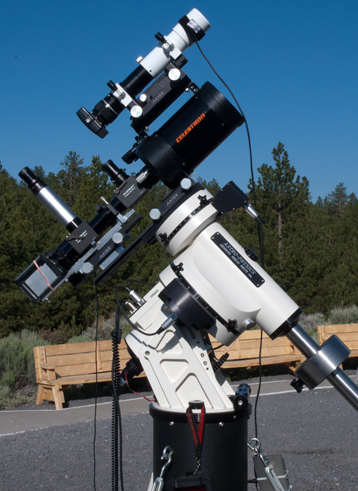
- 37 spectra were taken with the Celestron C-5, 1200 lines/mm Spectrograph
- It was dark Enough to see polaris
- We used a German equitorial mount
- Astronomy tip: The further north the higher polaris is
- Using the software "bullseye" we were able to center polaris with the telescope
- The software gave us multiple axis that we used to determine where the telescopes mechanical axis of the three axis that the software gave us, and the two locations (for polaris) recorded on the camera, we were able to discern the mechanical axis by locating the center point between the two locations of polaris (one the original recorded location, and the other the 180 degree rotation)
- 22:20 dark enough to view milky way
- This process has allowed us to calibrate the telescope for use at pine mountain
- Rotated telescope 180, adjusted its alt azto and focused it on Polaris, we used a plastic overlay on the computer to better calibrate the telescope to Polaris.
- After centering the telescope on Vega, we used the command "sync object" on the hand paddle to verify that the telescope was on Vega
- To verify that the telescope was properly calibrated, we used the "goto" command to locate Altair
- We had to recalibrate the telescope because Altair was not centered
- Then we calibrated the movement from Vega to Altair and vice versa, successfully
- The spectrograph celestron c-5, the 5 comes from its 5 inch light gathering, focal factor is 6.3'
- A red film, used to dampen white light, was covering the monitor which interfered with our view of the image colors
- 7934 was a 30 second image of Vega very clear and crisp image
- 7935 is a 1 sec image of Vega, was hair width, almost impossible to see
- 7936 is a 2 sec image, was an inch and a half and very hard to see
- 7937 is a 3 second photo, longer, 2 and half inches, still no color variation
- 7938 is a 4 second photo, visible, one color, 2 inches
- 7939 is a 5 second photo, half an inch shorter, one color
- 7940 is a 6 second photo, quarter inch shorter than last, same color
- 7941 is a 8 second photo, two and a half inches long same color
- 7942 is a 10 second photo, two and a half inches, no color variation
- 7943 is a 13 second photo, two inches, orange anomaly
- 7944 is a 15 second photo, two inches and a half, orange anomaly larger
- 7945 is a 20 second photo, 3 inches, anomaly still present
- 7946 is a 25 second photo, 4.5 inches, orange part still there
- 7947 is a 30 second photo, 4 inches long, mostly white and orange
- We centered telescope on Arcturus
- 7949 red side of spectrum a bit lighter, inch in length 15 second photo
- 7950 is a 8 second photo, 3 quarters of an inch, not very visible
- 7951 is a 4 second photo, nothing visible
- 7955 is a 1 minute photo, 5 inches long color varies
- This is a two minute photo, centered on the star but unlocked the tracking system, and the star moved across the picture giving us a wider spectrum
- The next is a 1 minute photo, similar to the last
- The next is again similar, mostly green but can see blue in the spectrum
- Now we go back to Vega to do a similar exercise
- Same as last but with less stripes
- Now to M57 (messier)
- 7961 is a 8 minute photo and the slit was made wider to capture the light of the dim messier
the photo was only a faint dot because it was an emission spectrum
- Sheliak
- 7962, 1 minute, balanced spectrum
we stopped tracking Sheliak
- 7963, 2 min, thin centered line 2 in,
we moved the telescope every 15 seconds
- 7964, 2 min, variety of color, thin spectrum
- 7965, 2 minutes solid, 1 stripe visible on red portion
- 7966, couldn't see much, retry
- 7967, nothing visible
- Switch on telescope was turned for viewing so the camera couldn't capture the last two images
- 7968 Mizra is finally visible, gap in the spectrum
3:20 to 3:40 equipment clean up
- Park telescope mount
- Put away optics and computers
- Put away things and cover them
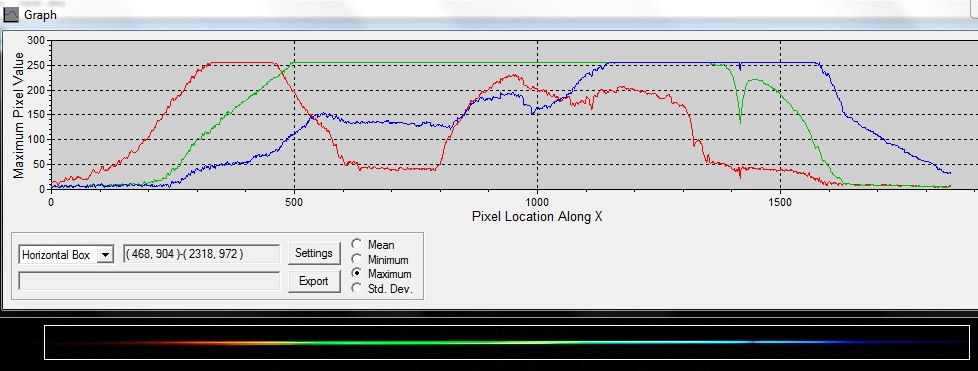
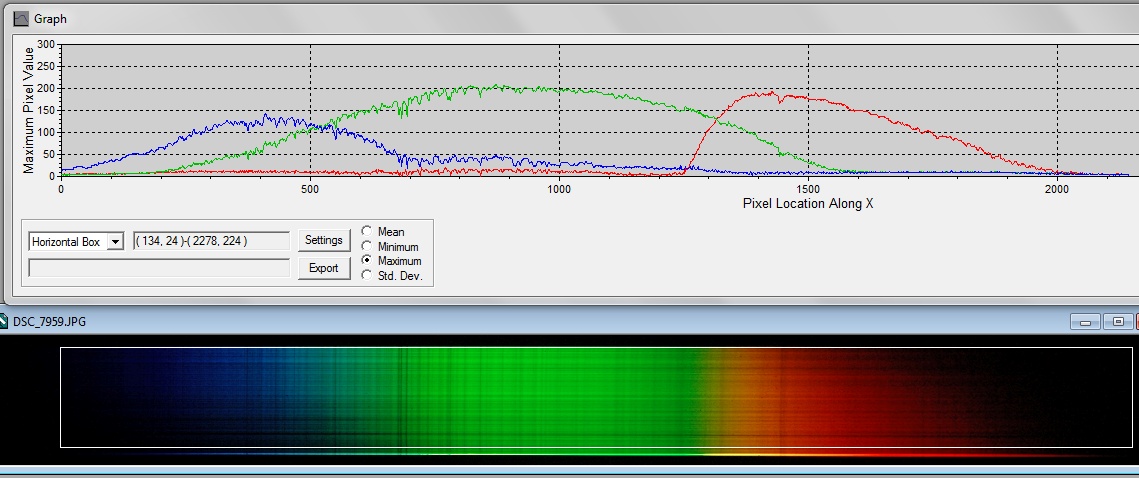
Vega Spectrum Analysis
- An example of the Vega spectrum clipped at 255 in the red, green and blue channels of the image.
- The below screen is from Diffraction Limited MaxIm DL V5.07.
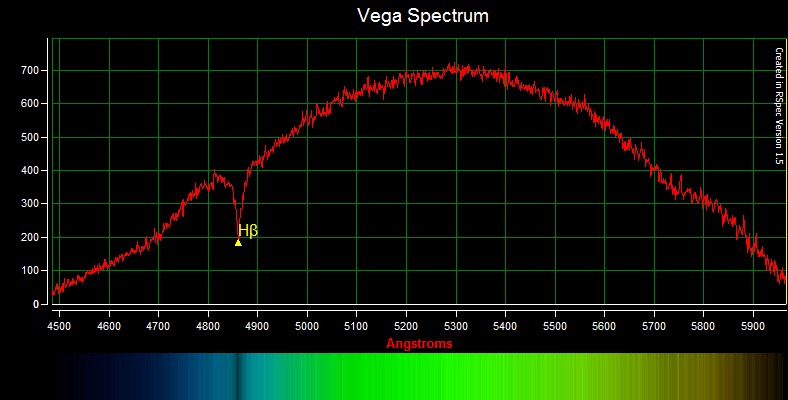
Vega Spectrum Not Clipped
- An example of the Vega spectrum in which the entire curve is visible under 255, in red, green, and blue
- The below screen is from Diffraction Limited MaxIm DL V5.07.
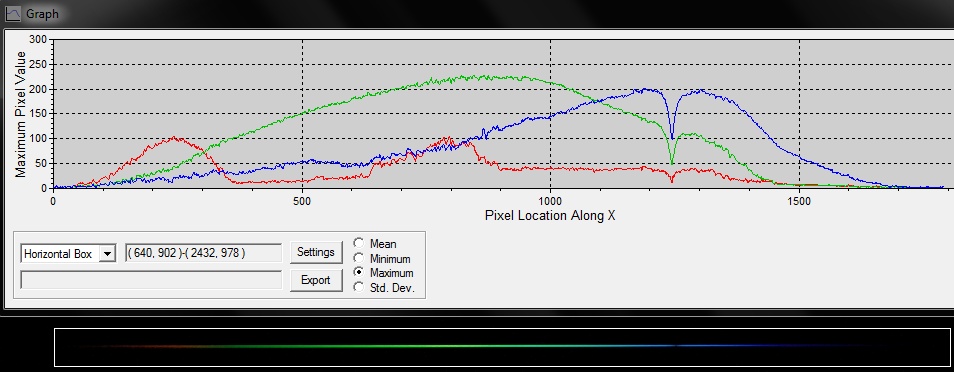
- In this image the H-beta absorption line is visible
- There are a lot of imperfections on this curve, most likely the result of noise and not absorption lines, except for the H-beta
- The spectrum below this graph is a synthetic spectrum created from the data, which is why there are no horizontal imperfections.
- The below spectrum is from Field Tested Software RSpec V1.5.0 Build 17.
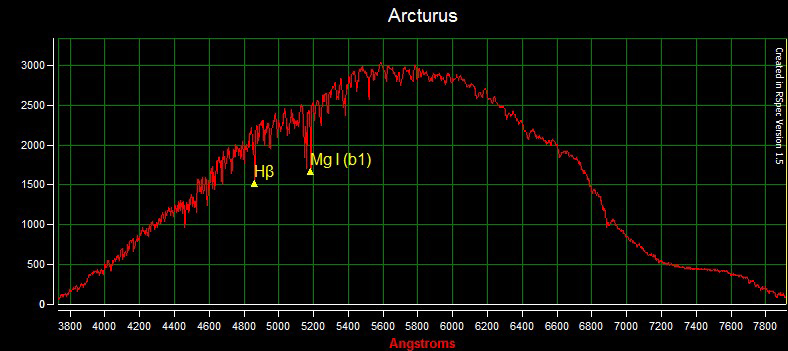
Arcturus Analysis
- An example of the Arcturus spectrum red, green and blue channels of the image are clear under 255.
- The below screen is from Diffraction Limited MaxIm DL V5.07.
- The below spectrum is from Field Tested Software RSpec V1.5.0 Build 17.
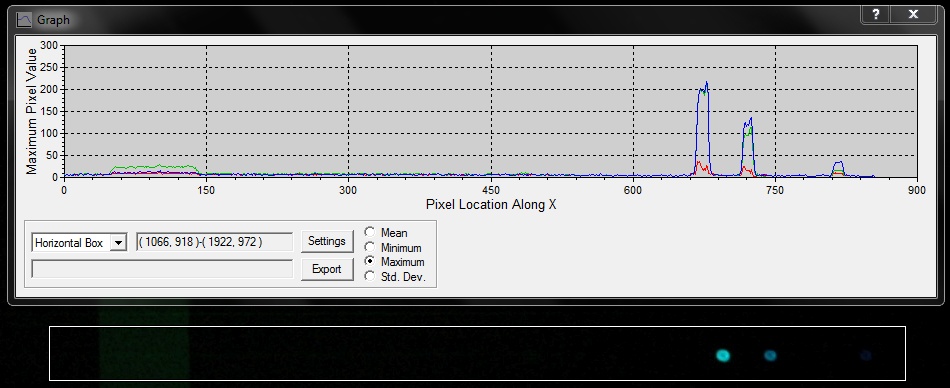
M57 Analysis
- An example of the M57 spectrum red, green and blue channels of the image are clear under 255.
- The image contains light pollution from Bend because the slit was made very wide in order to capture M57, small curve on the left and the yellow haze are the light pollution, while the three blue dots and three small blue curves represent M57
- The below screen is from Diffraction Limited MaxIm DL V5.07.
Monday August 16, 2012
Objectives
- Properties of light
- Introduction to spectrographs
13:00 to 15:00 Day time spectroscopy lab
- Learning objectives
- Understand the properties of light
- Identify continuous, absorption & amp; emission spectra
Light and The Electromagnetic Spectrum
Emission, Absorption & Continuous Spectra
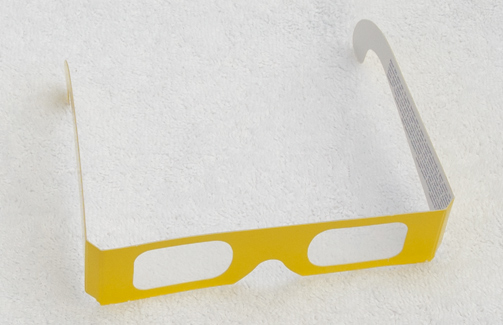
- Spectrum glasses.
- Hydrogen gas tube spectrum lab.
16:00 to 18:00 Workshop group meeting
- Informational presentations
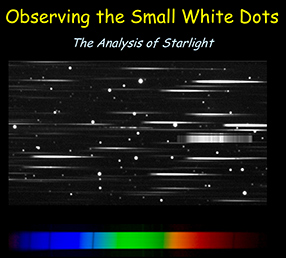
- Observing the Small White Dots, The Analysis of Starlight presentation by David Haworth ~ 60 minutes
21:00 to 22:30 Evening Night Lab in the 32 inch Telescope Dome
- Build a
Stanford Solar Center
spectroscope with a 1000 lines per mm grating
- On Monday the 16th the spectroscopy group made our own spectrographs
They were constructed very carefully in order to work properly on light sources
Each unit had its own eyepiece to look through thin film that shined a bright spectrum of colors in the component
The spectrum is measured on a scale that was placed on the left side of the unit to ensure the right placement of the scale.
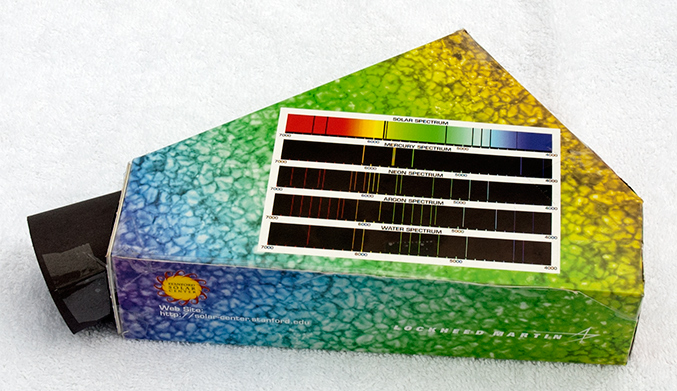
Looking through the spectroscope were different lightbulbs, the first and most basic was a Hydrogen light bulb with little complexity in the spectrum.
The next element was Helium, which provided an abundant spectra of many colors, we then looked at a neon light bulb, widely used in store lights, appeared equally brilliant.
The last lightbulb we looked through the spectrograph was Argon, and its spectrum was very hard to see in the spectrograph
- Grating lab with red, green and blue lasar.
- Mode 0
- Mode +1 and -1
- Mode +2 and -2
- Mode 2 red over lap with mode 3 blue.
- Mode +3 and -3
Tuesday August 17, 2012
Objectives
- Observe the Sun spectrum
- Identify H, Na and Mg elements in the Sun by their H-beta, Na doublet and Mg triplet absorption spectra
- Data calibration and analysis
- Solar spectrum
13:00 to 15:00 Day Time Spectroscopy Lab
|
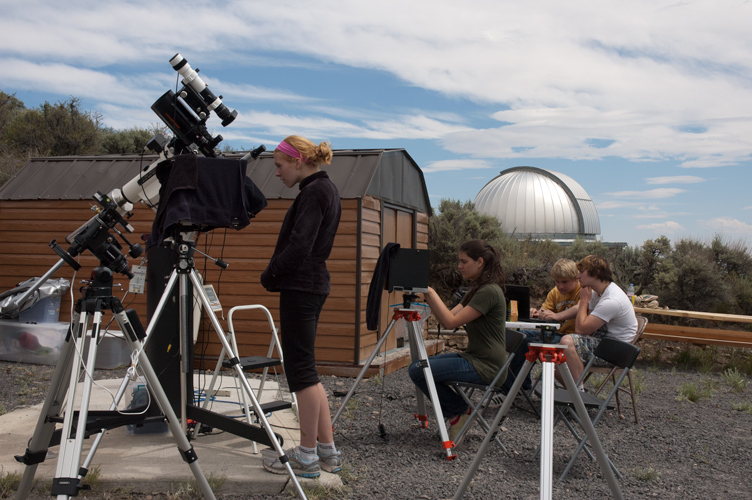
Spectroscopy Team Taking a Solar Spectrum Through the Clouds
- Anna Cramer at the Nikon D70 DSLR video monitor.
- Claire Prihoda at the first documentation station.
- Preston Carney at the second documentation station.
- Dashton Peccia at the second documentation station.
|
- Solar spectrum lab
33 spectra were taken with the Celestron C-5, 1200 lines/mm Spectrograph
- Overcast and patchy sky, clouds. 68 degrees F.
- Slit width initially at 9 mm *ISO 400*
- 7969 img 30 second exposure= results in continuous spectrum, white blob in middle due to light leak and overexposure
- 7970 img 30 second exposure= with fixed light leak= still overexposed
- 7971 img 25 second exposure= still over exposed
- Vertical stripes in blue and yellow (also visible in above 30 second exposures)
- 7972 img 20 second exposure= white area has gotten smaller, line in blue has become distinct
- 7973 img 15 second exposure= still over exposed but white zone receding
- 7974 img 13 second exposure= blue area becoming more evident, remains overexposed. Can see and identify faint magnesium triplet, and sodium doublet
- 7975 img 10 second exposure= the thickest of the magnesium lines half visible, still white area but becoming smaller
- 7976 img 8 second exposure= mostly the same as the previous image
- 7977 img 6 second exposure= looks same as img 7976
- 7978 img 5 second exposure= looks similar, the blue magnesium triple is fading and almost non existent
- 7979 img 4 second exposure= same as previous
- 7980 img 3 second exposure= bright spot dissipating so yellowish green can be seen near center
- 7981 img 2.5 second exposure= more green with faint vertical lines
- 7982 img 2 second exposure= green zone continues to grow
- 7983 img 1.6 second exposure= white getting smaller, more faint visible lines in green area
- 7984 img 1.3 second exposure= absorption lines visible in white
- 7985 img 1 second exposure= white is almost completely gone, slight haze between green and blue, clear absorption lines in green and teal
- 7986 img 1/1.3 second exposure= 2 green, 1 yellow, and several faint blue absorption lines
- 7987 img 1/1.6 second exposure= only half of green absorption lines visible
- 7988 img 1/2 second exposure= absorption lines in blue becoming darker, no more lines visible in green
- 7989 img 1/2.5 second exposure= many blue absorption lines
- 7990 img 1/3 second exposure= absorption line near green and yellow border
- 7991 img 1/4 second exposure= green taking up more space, more faint absorption lines in blue, one clear line in yellow
- 7992 img 1/5 sec. exposure = same as last
- 7993 img 1/6 sec. exposure = 3 faint absorption lines in green, lines in blue more prominent, yellow is less visible, orange more visible
- 7994 img 1/8 sec. exposure = 4 lines visible in green, same as last image
- 7995 img 1/10 sec. exposure = lots of blue absorption lines, same as last
- 7996 img 1/13 sec. exposure = light blue disappearing and all the blue is separated into various hues, the whole spectrum has shrunk, the violet and red ends are disappearing, green is faint but there are lots of absorption lines
- 7997 img 1/15 sec. exposure = spectrum getting smaller, green absorption lines are darker red is encroaching in the yellow and orange area
- 7998 img 1/20 sec. exposure = spectrum very small, blue is almost invisible, orange almost completetely overshadowed by red, red is also much smaller
- 7999 img 1/25 sec. exposure = blue reappeared, green still has >7 absorptions lines, red and blue each have an absorption line
- 8000 img 1/30 sec. exposure = blue is cut off at the bottom, same
- Each group member observed the sun's spectrum through a screwdriver solar spectroscope
- Claire: First absorption line is in orange, faint in yellow and green, also 2 located in dark green area, four in the blue, one in the purple
- Anna: Two prominent in the green
- Preston: One absorption in the blue, one in the red, and one in the dark blue, one violet, one dark red
21:00 to 1:30 Spectroscopy Team Meeting
- Prepare report out presenation and web pages during the thunder and lighting storm in the 32 inchs telescope dome.
Solar Spectrum Analysis
- An example of the Solar spectrum red, green and blue channels of the image.
- The below screen is from Diffraction Limited MaxIm DL V5.07.
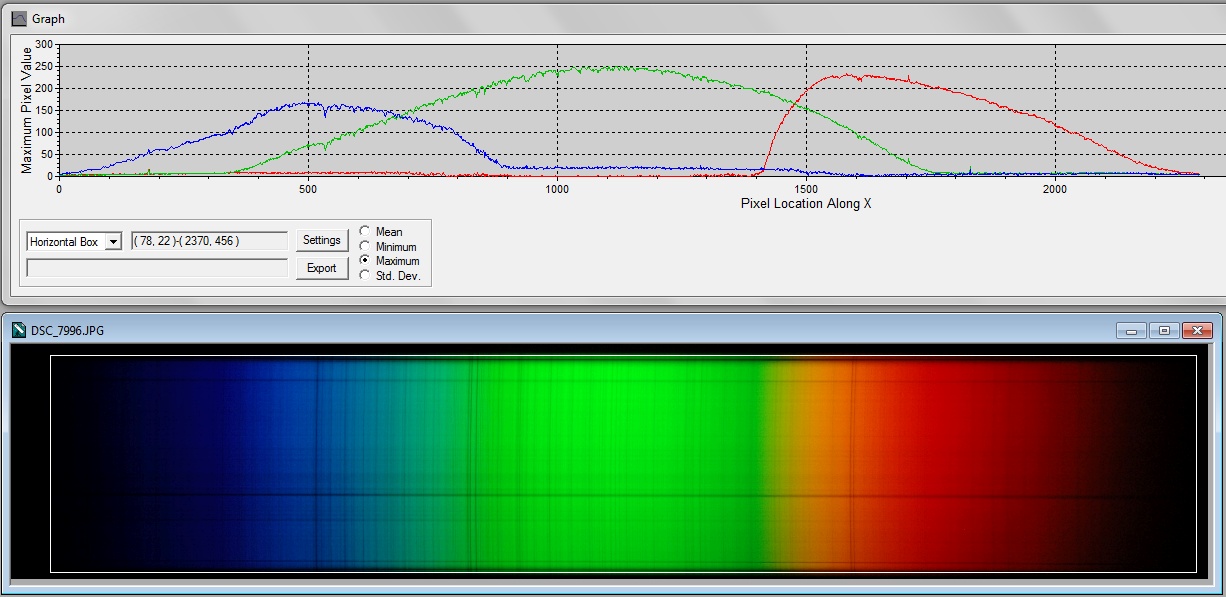
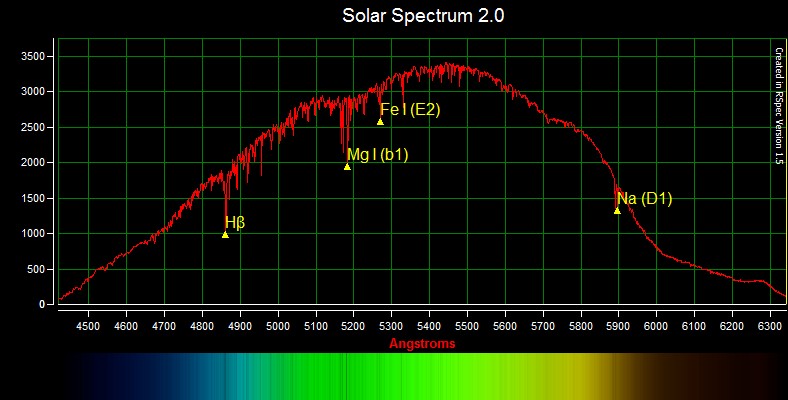
- In this spectrum H-beta, the magnesium triplet, the sodium doublet, and Iron I are visible absorption lines.
- The spectrum below this graph is a simulation based on the data in the graph, which is why there are no horizontal imperfections.
- The spectrum below is from Field Tested Software RSpec V1.5.0 Build 17.
Wednesday August 18, 2012
Objectives
- Prepare report out presenation and web pages
13:00 to 16:00 Day time spectroscopy lab
- RSpec lab
- Data reduction lab
- Prepare report out presenation and web pages
16:00 to 18:00 Workshop group meeting
- Spectroscopy team report (this web page)
21:00 to 2:40 Spectroscopy Imaging Notes
- Spectra were taken with the Celestron C-5, 1200 lines/mm Spectrograph
- July 18, 10:21 pm, mostly clear sky with few scattered clouds
- Vega, slit at 10, adjusted spectograph so H-beta is at center of
screen so shorter gamma waves can be seen, ISO 1600 2 minute exposure, but at 20 seconds tracking is disabled:
- ...Vega...
- Antares:
- smearing didnt work, star too dim
- 8037 1 min, camera saturated
- 8038 30 sec, better but still saturated
- 8039 15 sec, still saturated
- 8040 8 sec, image decreased
- Arcturus
- 8041 8 sec. too small
- 8042 30 sec. longer but saturated
- 8043 30 sec. no tracking, wider, mg triplet visible
- 8044 1 min, no tracking, wider, clear lines
- Alioth
- 8045 1 min, too bright, H-beta visible
- 8046 30 sec, h-beta visible
- Mizar
- 8047 30 sec, h-beta visible but needs more exposure
- 8048 1 min, nothing
- 8049 1 min, better, a little cut off
- 8050 2 min, h-beta
- Dubhe
- 8051 2 min, a couple faint absorption lines
- 8052 1 min, nothihg
- 8053 1 min, patchy spectrum
- Kochab
- 8054 2 min, Bright, patchy
- 8055 1 min, Bright, patchy
- 8056 30 sec, patchy
- 8057 15 sec, too faint
- Rastaban
- 8058 15 sec, small, dim, 1 in long, 4 dim absorption lines
- 8059 30 sec, 2 in, 4 dim absorption ilnes
- 8060 1 min, nothing, mirror down
- 8061 2 min
- 8062 70 sec
- 8063 mirror was down
- 8064 4 min
- Eltanin K5III
- 8065 4 min
- 8066 2 min
- 8067 1 min
- 8068 30 sec
- 8069 30 sec
- 8070 2 min, +Ne
- 8071 2 min, +red Hg CFL
- 8072 2 min, +white 4 inch Hg
- 8073 2 min
|