<<PREVIOUS -
HOME -
CONTENTS -
NEXT>>
NSI 2011 INDEX -
![]()
Selecting the Best Vega Spectrum with RSpec
|
|
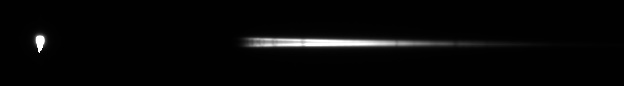
The above image is the star Vega (Wikipedia). The round spectral order zero is on the left side of the image and its first order blazed grating spectrum is on the right side.
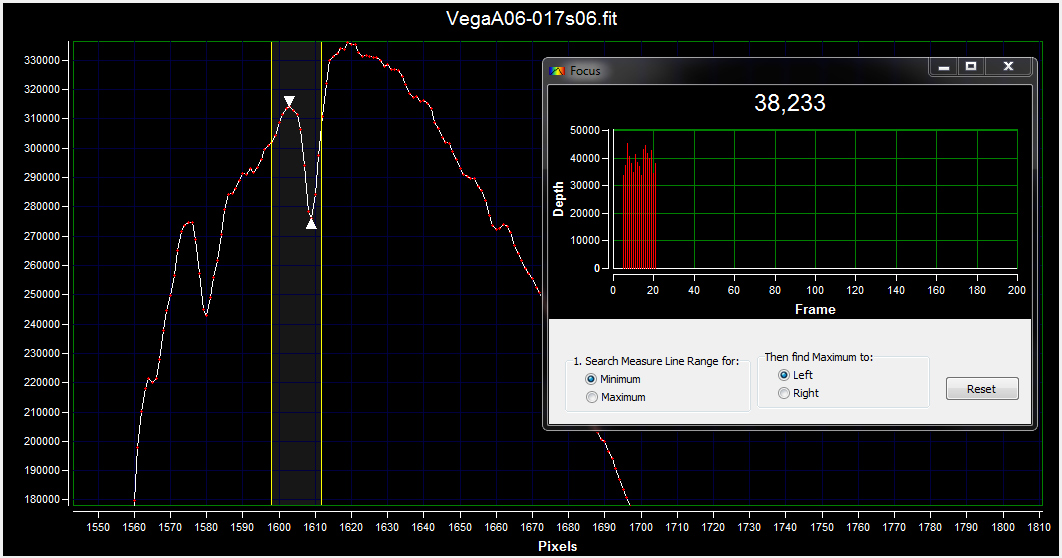
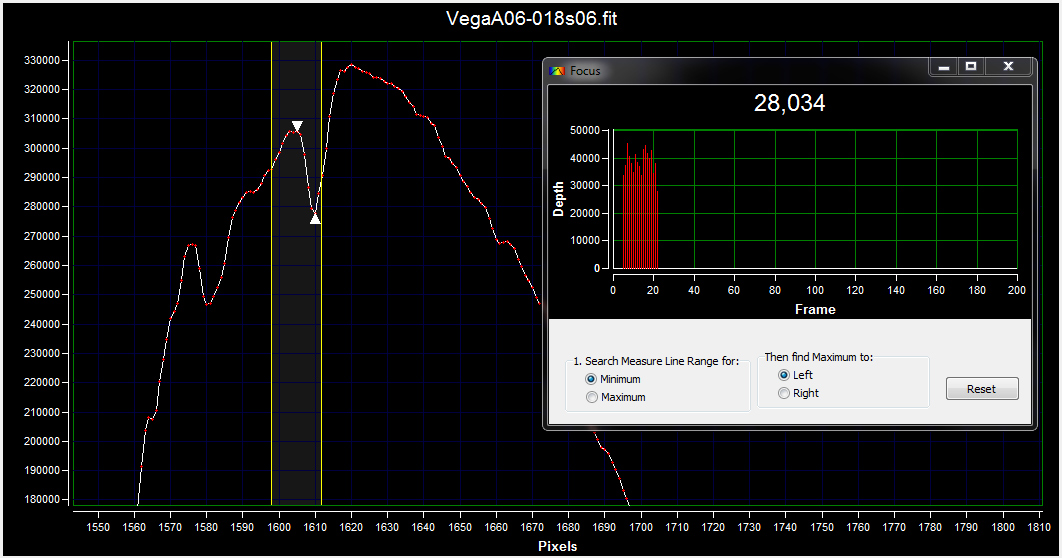
This web page shows how Field Tested Software RSpec V1.3.0 (Build: 39) was used to select the best image of 18 FIT images that were taken.
Vega is a bright star and the exposure was 0.6 seconds with the Rainbow Optics 200 lines/mm diffraction grating spectroscope. The 18 images were taken in seven minutes. The H-delta absorption line varies quite a bit among the 18 images. Therefore, take lots of images and pick the best one for spectrum analysis.
RSpec configuration:
- Empty the RSpec Capture directory.
- Start RSpec V1.3.039.
- In Tools Options used full 32-bit processing on FITS images.
- Check RSpec Auto-Open new files.
- Drag and drop a copy of the first Vega FIT image with a different file name in to the RSpec Capture directory.
- A copy of first image is used to configure RSpec and it will not be recorded in the Focus window.
- Move the capture box close to the star spectrum, but not too close so that in the other images the star drifts out of the capture box.
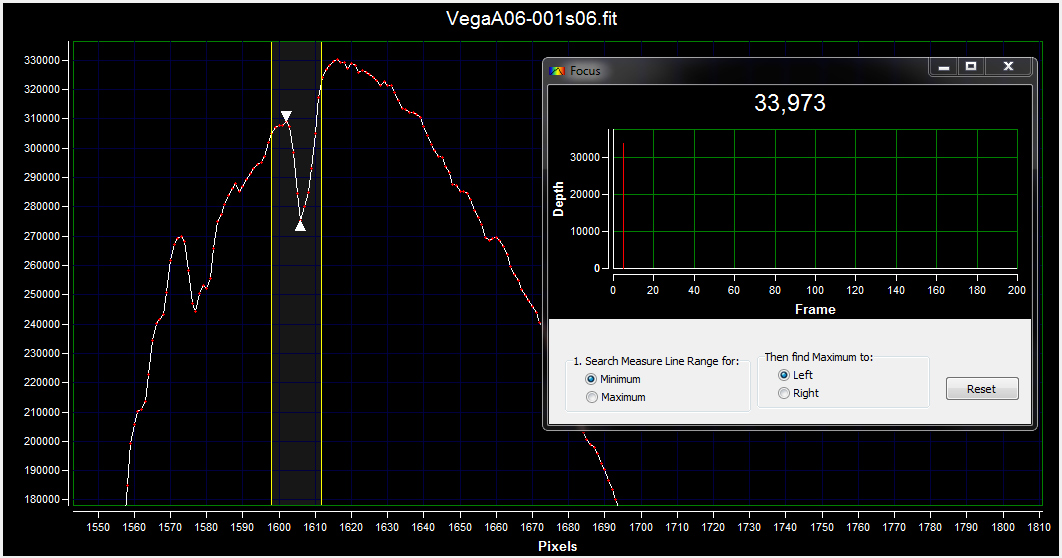
- Zoom in on the profile showing H-beta, H-gamma and H-delta absorption lines.
- Check Show Measure Lines.
- Move Measure Lines to select left side of the H-beta absorption line.
- Check Show Focus Tool.
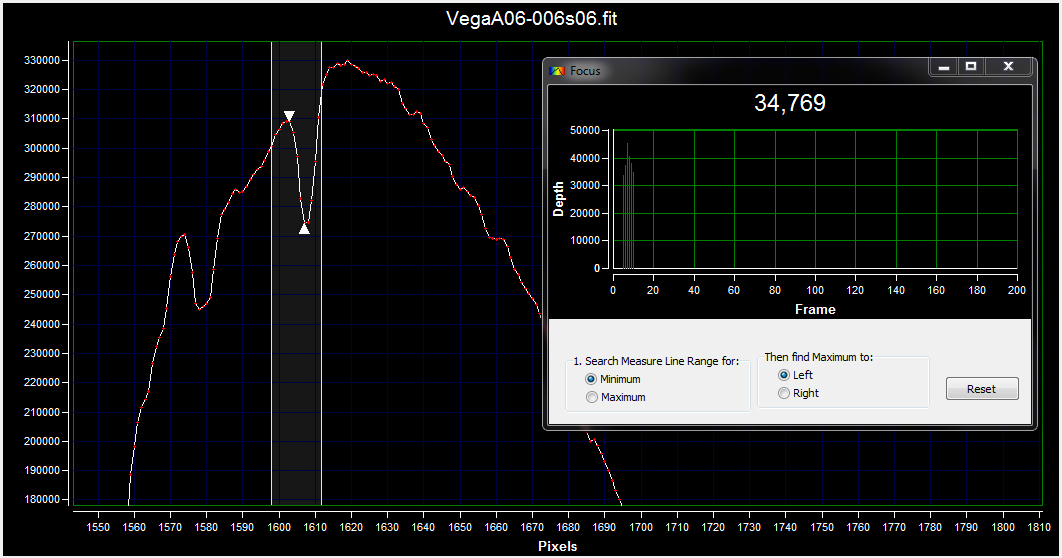
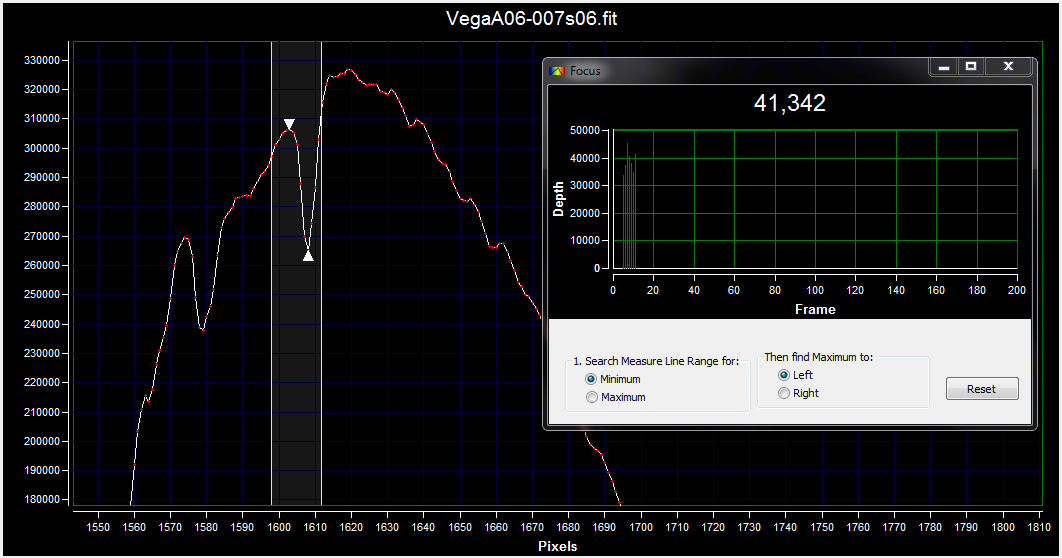
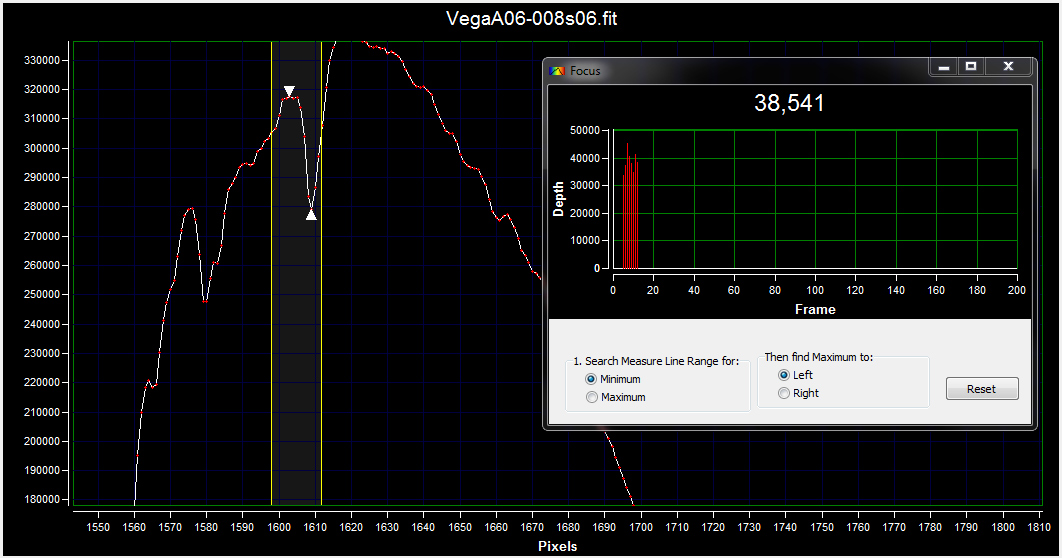
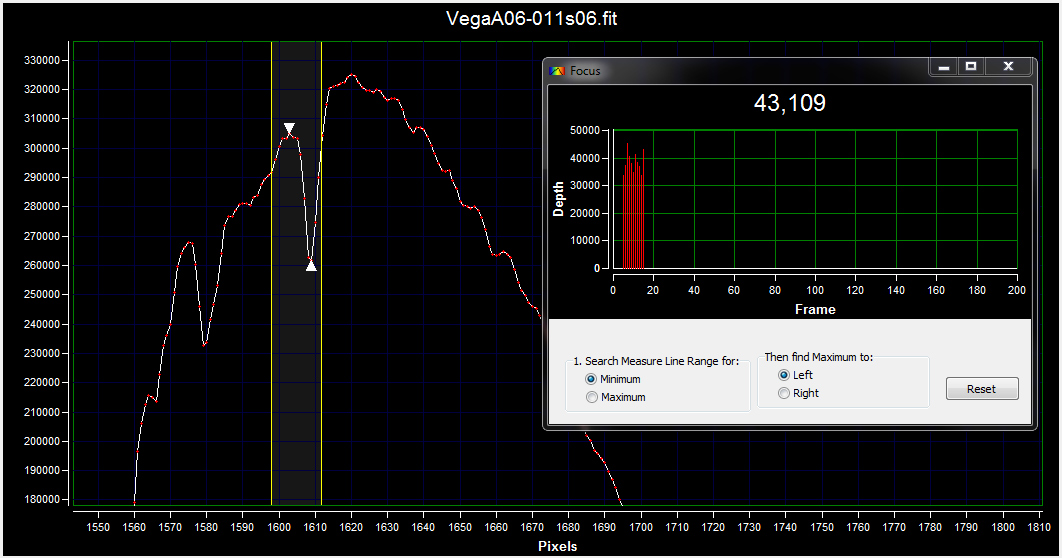
- Check Focus Tool search Measure Line Range for Minimum and then find Maximum to the left.
- Drag and drop each Vega FIT in to the RSpec Capture directory.
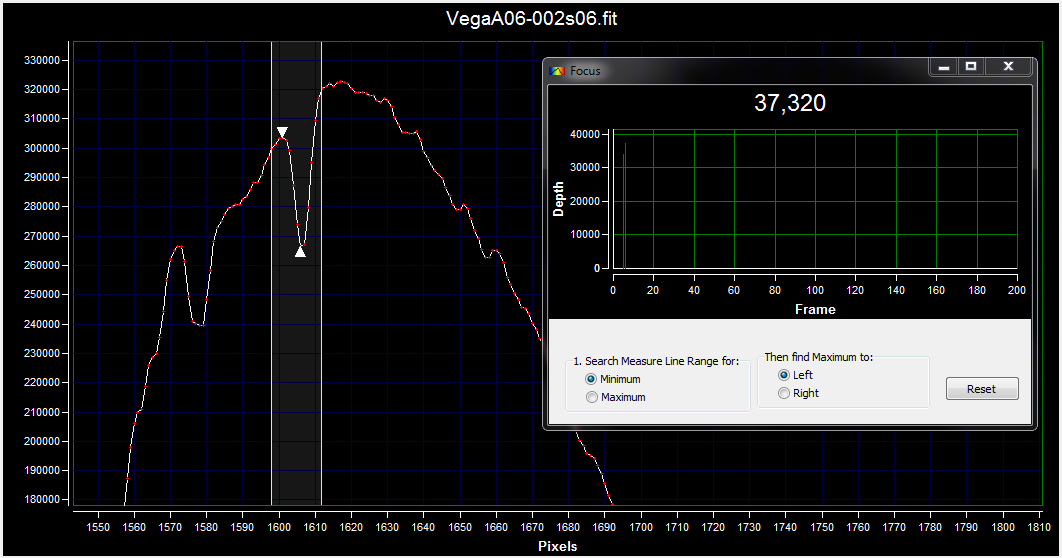
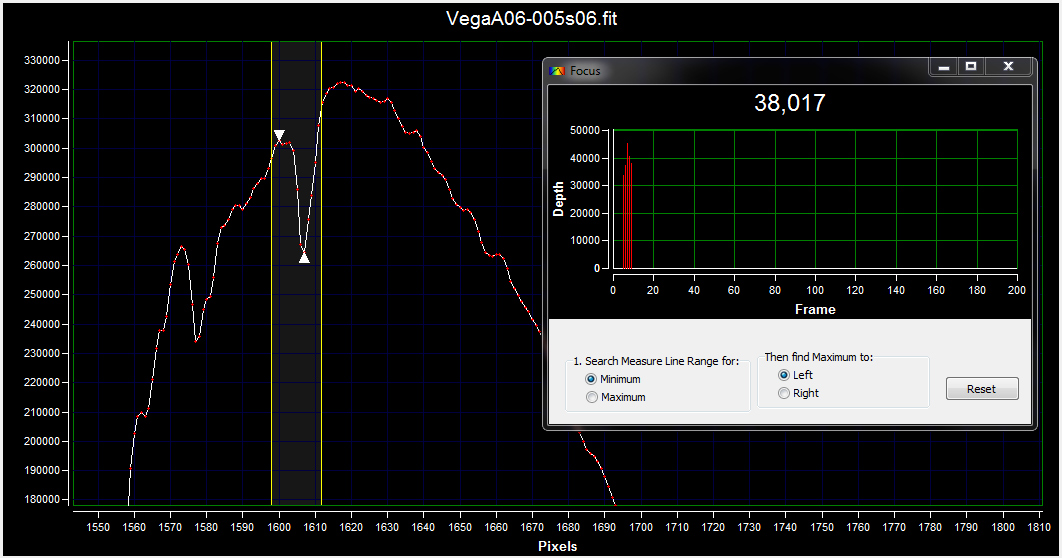
- Each Vega image is measured and plotted in the Focus window.
- Screen capture each Vega profile with measurement with IrfanView.
- Analyze the screen captures with IrfanView to select the best Vega image.
Vega image 003 has the largest number 45,681 but I chose image 012 with the second largest number 44,695 because image 012 H-delta looked better than image 003 H-delta.


Monitor Test Pattern
The following test pattern is to help you adjust your monitor to best view the CCD astro images. The test pattern is used for adjusting monitor brightness, and contrast. Adjust monitor brightness and contrast to see all 16 gray scale levels. The most important adjustment when viewing astro images is to see the differences in all of the black bands.