<<PREVIOUS -
HOME -
CONTENTS -
NEXT>>
NSI 2011 INDEX -
![]()
Quasar KUV18217+6419 Redshift Analysis
|
|
|
|
|
Spectrum Analysis Summary
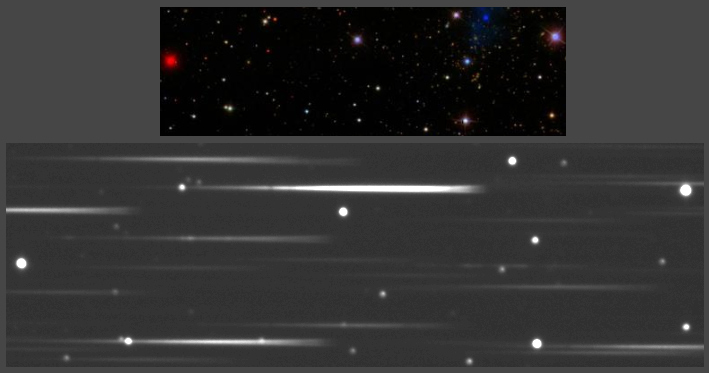
In the above image is a positive and negative image of Quasar KUV18217+6419 round spectral order zero is on the left side of the image and it's first order blazed grating emission spectrum is on the right side.
It is standard to show the spectrum with the short wavelengths on the left and the long wavelengths on the right. Therefore, north is at the bottom edge of the above images.
- In the KUV18217+6419 image north is at the bottom edge and in SDSS images north is at the top edge.
- The bright star on the bottom right edge is a 16.29 magnitude (red) SDSS J182302.81+642110.1
- The dim star above SDSS J182302.81+642110.1 to the left and below next to the spectrum is a 17.69 magnitude (red) SDSS J182301.35+642102.7
- The dim star above SDSS J182302.81+642110.1 to the far right and below next to the spectrum is a 19.09 magnitude (red) SDSS J182313.60+642106.5
- The Quasar KUV18217+6419 (NED) measured H-alpha, O[III], H-beta and H-gamma emission lines redshift is z= 0.297 NASA-IPAC Extragalactic Database value of 0.297000.
- Based on KUV18217+6419 measured redshift (z= 0.297) it's light travel time was 3.269 Gyr. For comparsion:
- Based on Ho= 73.0; Ωmatter = 0.27; Ωvacuum = 0.73.
- Age of the universe is 13.292 Gyr
- Age of the solar system is 4.5 Gyr.
- Based on Ho= 73.0; Ωmatter = 0.27; Ωvacuum = 0.73.
- Sloan Digital Sky Survey SDSS information on KUV18217+6419
Locating Quasar KUV18217+6419 Image
|
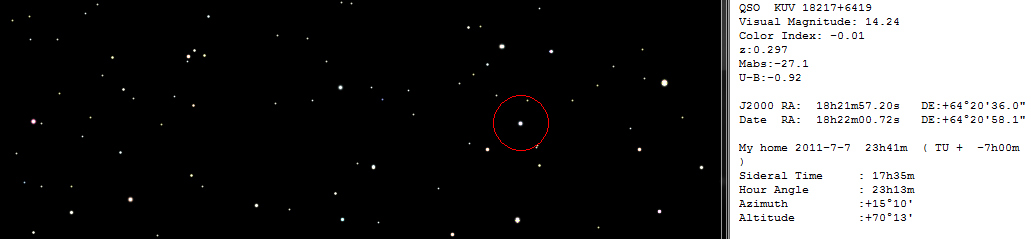
- The top image is SDSS image with the Quasar KUV18217+6419 as the light blue object of the right side. The bright blue star at the right side top is a V* DS Dra -- Pulsating White Dwarf, PK 94+27.1 (CDS).
- The middle image is the Quasar KUV18217+6419 spectrum image.
- The bottom screen capture is Sky Charts showing Quasar KUV18217+6419.
- North is up in both images. Quasar KUV18217+6419 spectrum image is rotated a few degrees counter clockwise.
- With north up the Quasar KUV18217+6419 spectrum is now on the left side of the zero order image.
- Quasar KUV18217+6419 full frame spectrum image with north at top edge
Spectrum Area Plot
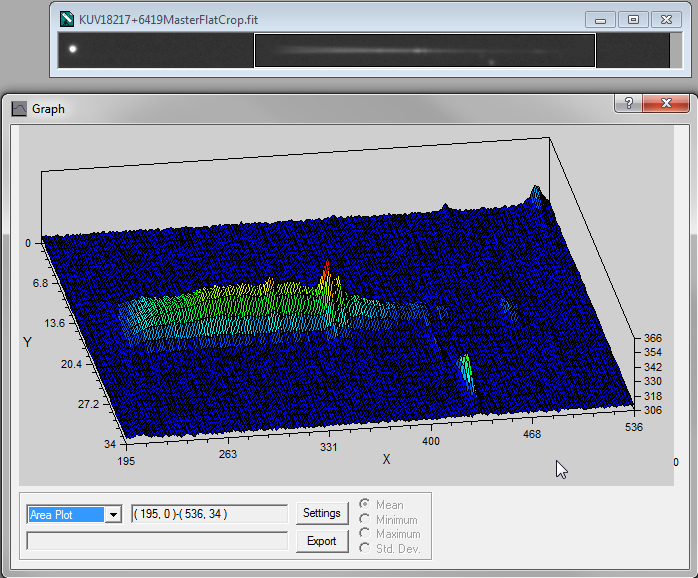
- Spectrum area plot showing the H-beta peak in red.
- The H-alpha peak is the small hill to the far right of the H-beta peak.
- Area plot aspect ratio is not square.
- MaxIm DL area plot
Spectrum Chart
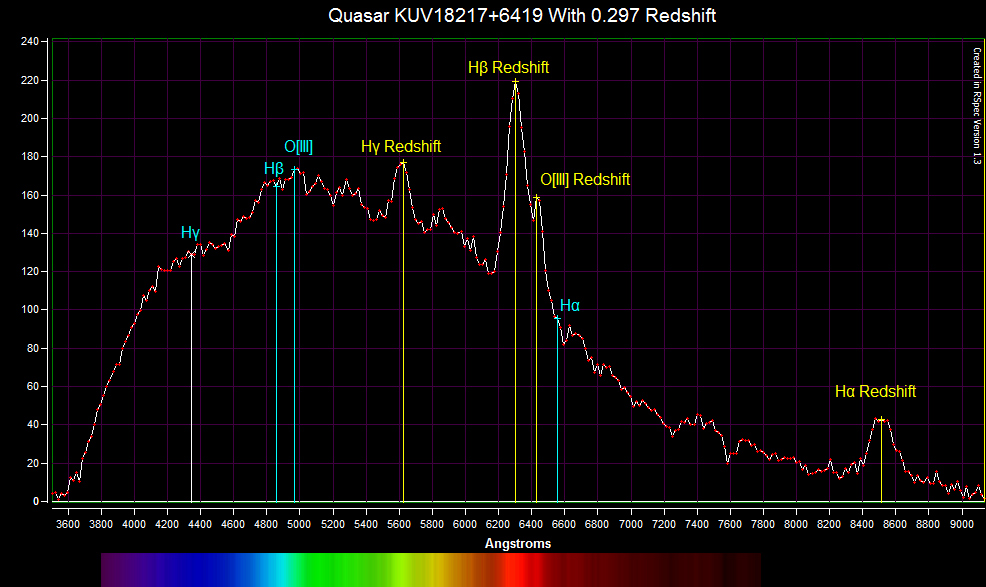
- The vertical axis is the intensity values of the spectrum image.
- Four emission reference line markers were added to show the calculated redshift (NED z=0.297000) of the elements.
- The KUV18217+6419 observed H-alpha is at 8512 � which is above the normal human vision range of 3800 � to 7400 �.
- It is very impressive that the QSI532ws CCD camera successfully captured the H-alpha at 8512 �.
- RSpec spectrum chart
Signal to Noise Ratio
|
|
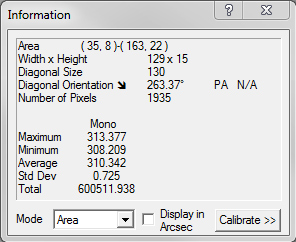
The following backgroungd measurements are of the above white selection box.
- Background Average: 310.342
- Background Standard Deviation: 0.725
- Background Average/Standard Deviation: 428.057931
- Spectrum Maximum: 363.254
- (Spectrum Maximum Signal - Background Average)/(Background Standard Deviation) = Spectrum Maximum to Background Noise Ratio: 72.98206897
- MaxIm DL area measurements.
- Cropped KUV18217+6419MasterFlatCrop.fit image
- AIP4WIN V2.3.0 Series Analysis on all images and calibration frames.
- Diffraction Limited MaxIm DL V5.07.
- Create master dark with SD Mask combine (3 passes and 0.50 sigma factor) of 19 darks (5 minutes each at 23°C).
- Create master flat
- SD Mask combine (3 passes and 0.50 sigma factor) 128 two second flats darks.
- SD Mask combine (3 passes and 0.50 sigma factor) 128 two second flats with linear normalization, area 50%, ignore pixels over 65,000.
- Calibrate the 38 images (5 minutes each at 23°C) with master dark and master flat.
- SD Mask combine (3 passes and 0.50 sigma factor) the 38 images with linear normalization, area 50%, ignore pixels over 65,000.
- Save as FIT.
- Crop and save as FIT and JPG (image at top of this web page).
- Field Tested Software RSpec V1.3.0 (Build: 39).
- Spectrum analysis
Monitor Test Pattern
The following test pattern is to help you adjust your monitor to best view the CCD astro images. The test pattern is used for adjusting monitor brightness, and contrast. Adjust monitor brightness and contrast to see all 16 gray scale levels. The most important adjustment when viewing astro images is to see the differences in all of the black bands.