<<PREVIOUS - HOME - CONTENTS - NEXT>>
SUN SPECTRUM INDEX - New

Sun Spectrum
5100 to 5150 Angstroms

Sun Spectrum


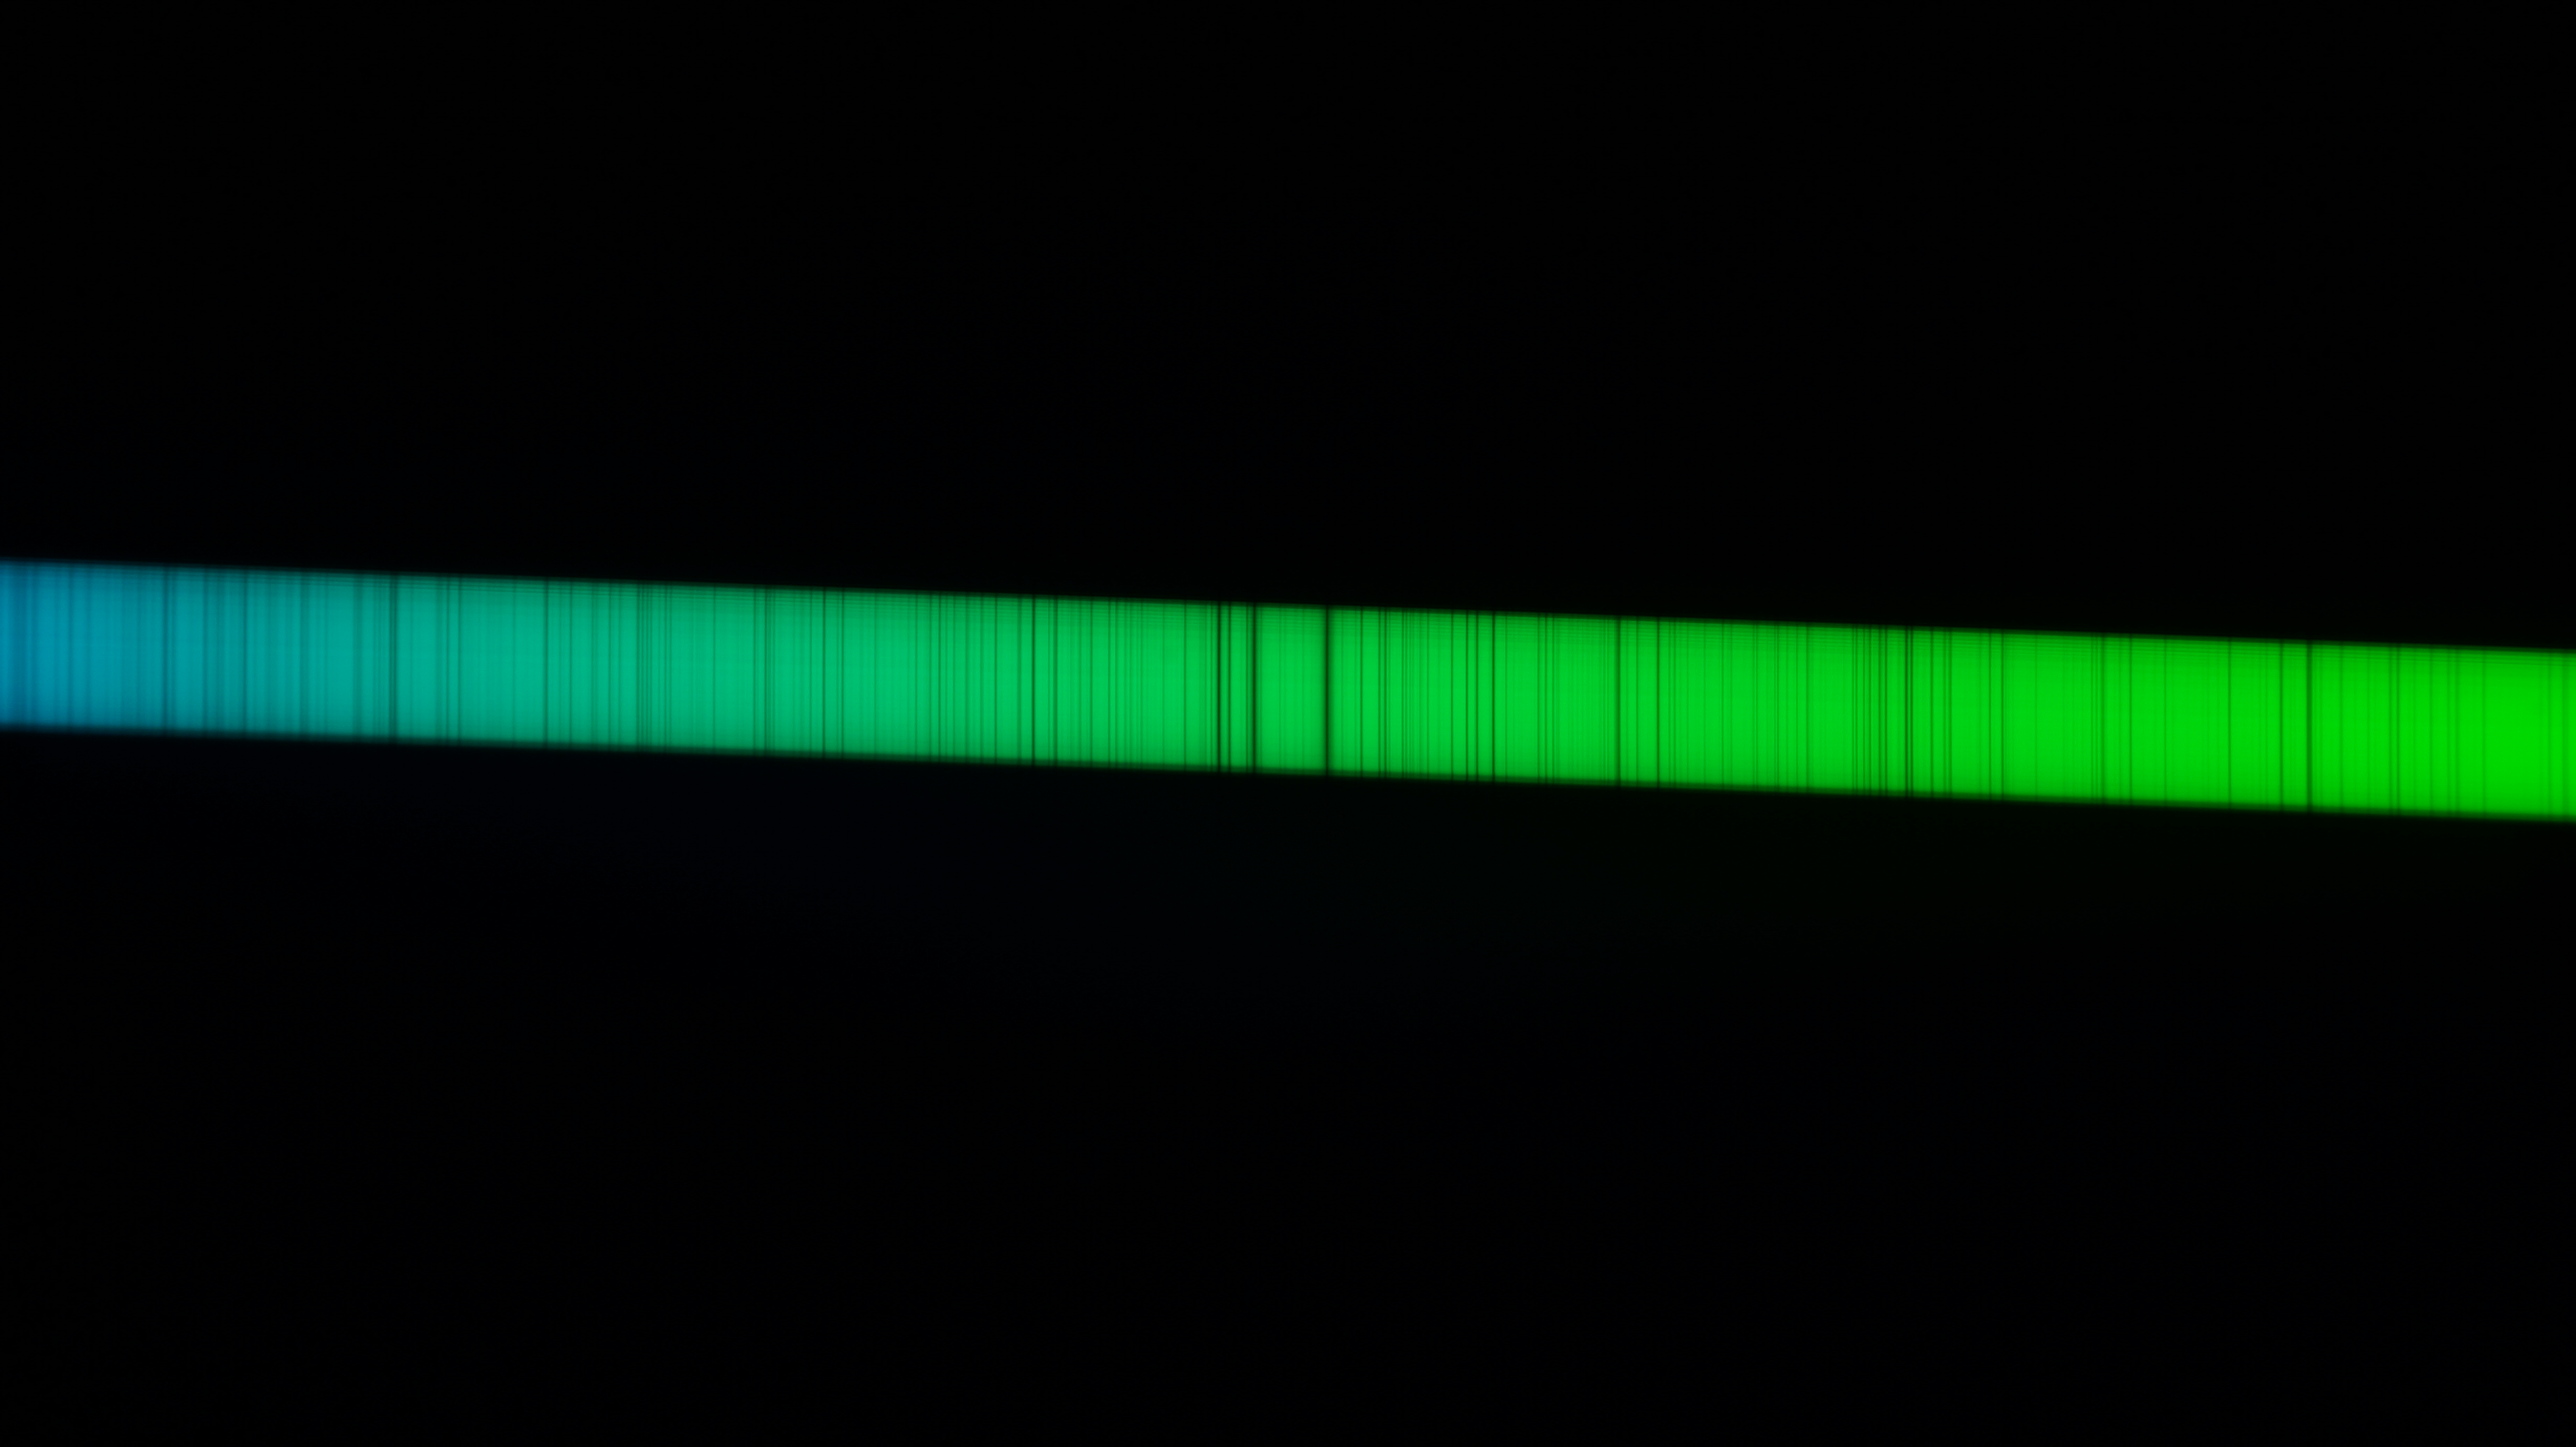
Summary

The above sunlight spectrum is 100% scale image and the image is cropped for a span of ~50 Angstroms. Seventy four vertical absorption lines are identified that represents 15 different elements.


Sony NEX-6 Camera Image

The below image is vertically cropped and it is 25% size of the full image size of 4912 x 2760. The Sony NEX-6 camera auto rotate cannot be turned off. Therefore, the full scale image may be rotated when displayed.

The camera is mounted on the spectrograph so that the dark absorption lines are vertical. The focus is soft at both ends of the spectrum and only the center portion of the spectrum image is used for analysis.

Sun Spectrum quarter size


YouTube Videos


Astronomical Spectroscopy

The Sun's visible spectrum is light that is spread out and it is measured by its wavelength and intenstiy. By analyzing the absorption lines in the spectrum we can determine the elements in the Sun's photosphere. Absorption spectroscopy is based on Gustav Kirchhoff's laws of spectroscopy. First, the core of the Sun is hot and it produces light with a continuous spectrum. Secondly, this light with a continuous spectrum travels through parts of Sun's photosphere which have a gas that absorbs light at specific wavelengths depending upon the elements in the gas and the elements atomic energy states. By comparing the absorption spectral lines in a lab on Earth with the Sun's absorption spectral lines we can determine the elements in the Sun.

Light is a form of electromagnetic radiation. Two properties of electromagnetic radiation is frequency f and wavelength λ. The electromagnetic radiation frequency and wavelength are related by the speed of light c = f * λ.

A photon is a quantum of light. The energy and momentum of a photon is equal to the frequency times Planck constant. As a result, different frequencies (different wavelengths) have unique different energies.

The energy levels of atoms are discrete. To move between atomic energy levels requires the addition or removal of the energy difference between the two energy levels. For example, one way to increase the atom's energy level is for the atom to absorb a photon that has the same energy as the energy difference between two energy levels. This is what happens when creating an absorption line. In other words, atoms absorb photon at only specific energy levels that results in the atom's increase in energy.

An emission line is when the atom's energy level decreases and a photon is emitted from the atom with the same energy. In other words, atoms emit photons at only specific energy levels that results in the atom's decrease in energy.

For more information see


Solar Spectrum Charts

The below solar spectrum charts span ~50 Angstroms in the horizontal axis. There are 653 horizontal data points. The red points are the data points from the image pixels and pixels are 0.0797 Angstroms/pixel.

The vertical axis is uncalibrated light intensity and it is the sum of the light intensity in the image columns. The spectrum below the plot is synthesize from the plot data.

Sun Spectrum


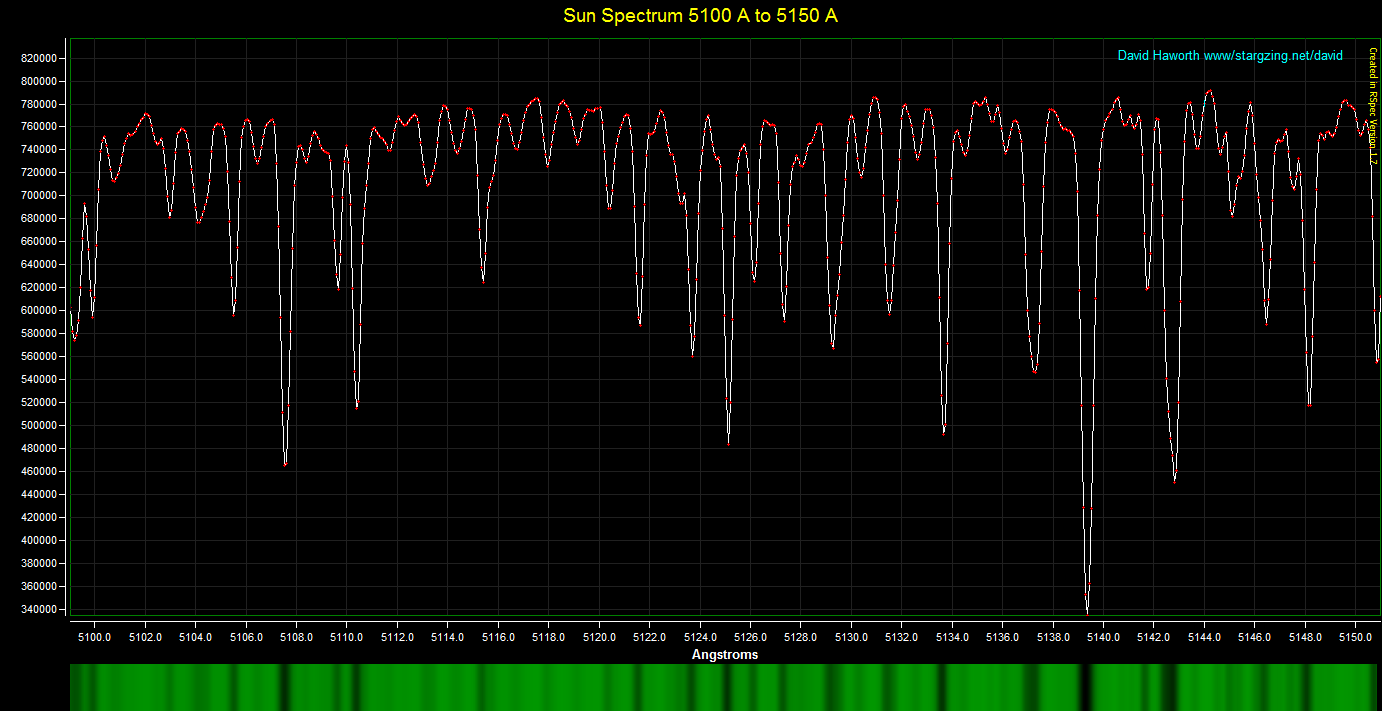
Elements Identified in this Sun Spectrum Plot by Their Absorption Lines

Angstroms, Element, Degrees of Ionization, (Fraunhofer Line)
5150.838 Fe 1
5100.664 Fe 2
5102.958 Ni 1
5104.029 Fe 1
5104.185 Fe 1
5104.436 Fe 1
5105.537 Cu 1
5106.458 Fe 1
5107.446 Fe 1
5107.641 Fe 1
5108.397 Fe 1
5109.650 Fe 1
5110.358 Fe 1
5110.413 Fe 1
5111.855 Fe 1
5112.270 Zr 2
5113.126 Cr 1
5113.234 Fe 1
5113.440 Ti 1
5114.510 Fe 1
5114.559 La 2
5115.389 Ni 1
5115.776 Fe 1
5117.934 Mn 1
5119.112 Y 2
5120.352 Fe 2
5120.415 Ti 1
5121.557 Ni 1
5121.641 Fe 1
5122.115 Cr 1
5122.767 Cr 1
5122.768 Co 1
5123.211 Y 2
5123.266 Fe 1
5123.279 Fe 1
5123.719 Fe 1
5123.779 Nd 2
5124.602 Fe 1
5125.112 Fe 1
5125.228 Ni 1
5126.132 Fe 1
5126.182 Cr 1
5126.192 Fe 1
5126.198 Co 1
5127.339 Fe 1
5127.345 Fe 1
5127.358 Fe 1
5128.034 Si 1
5128.082 Ni 1
5129.152 Ti 2
5129.370 Ni 1
5130.424 Cr 1
5131.468 Fe 1
5132.669 Fe 2
5187.914 Fe 1
5133.681 Fe 1
5134.647 Fe 1
5135.140 Pr 2
5136.092 Fe 1
5137.070 Ni 1
5137.382 Fe 1
5139.251 Fe 1
5139.255 Ni 1
5139.462 Fe 1
5141.739 Fe 1
5142.446 Fe 1
5142.494 Fe 1
5142.541 Fe 1
5142.775 Ni 1
5142.926 Ni 1
5142.928 Fe 1
5143.722 Fe 1
5144.668 Cr 1
5145.094 Fe 1
5145.201 Si 1
5145.460 Ti 1
5146.480 Ni 1
5147.478 Ti 1
5148.036 Fe 1
5148.229 Fe 1

The source for the above elements is KPNO FTS The Sun Disk Averaged 1981 Normalized Flux Solar rest wavelengths from The Interactive Database of Spectral Standard Star Atlases.

Element Symbol and Name

Degrees of Ionization of Atoms

  • 1: Not ionized (neutral atom)
  • 2: Singly ionized (Singly negatively charged ion)
  • 3: Doubly ionized (Doubly negatively charged ion)

The below plot shows the location of the element absorption lines in the Sun's spectrum.

Sun Spectrum


Sun Spectrum RSpec Synthesize Settings
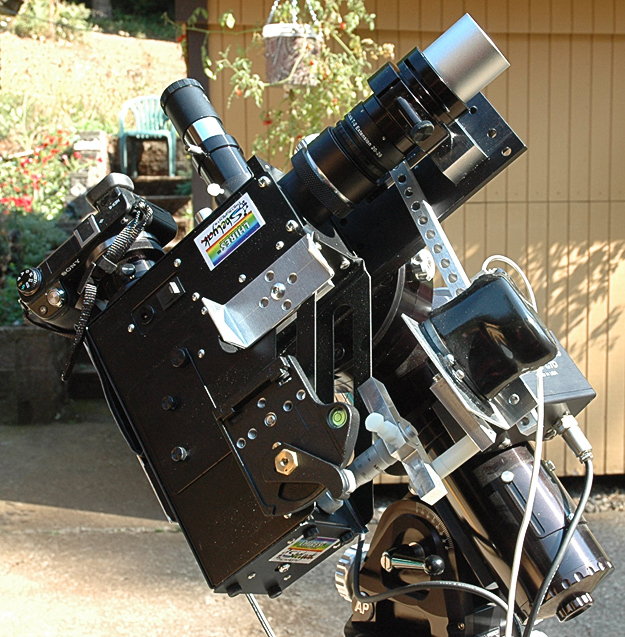
  • Color
  • Contrast 0.6


Shelyak Instruments Lhires III Solar Spectrum

Equipment

  • YouTube Video: Mg Triplet Solar Spectrum - Lhires III, NEX-6 showing the equipment used to take images of the Sun's spectrum.
  • Shelyak Instruments Lhires III
    • Grating module 2400 gr/mm
    • Sun spectrum Lhires III micrometer settings
    • Model#: SE0082 CCD adapter for Lhires III to mount a QSI ccd camera ('ws' front plate) on a Lhires III. Thread: M42x0.75 backfocus: 34.9 mm
    • Celestron 25mm eyepiece and 2X Barlow in the guider port
      • NOT USED FOR SOLAR IMAGING
      • Used for Moon imaging
    • Model#: PU0024 Photographic Tripod Adapter
  • Optics attached to the Lhires III
    • Baader T2 Extension Tube - 40mm for lens shade
    • Edmund Optics T-Mount Iris Diaphragm Barrel Stock #52-299 to reduce the Sun light.
    • Edmund Optics Achromatic Doublet Lens 40mm Dia. x 160mm FL, MgF2 Coating Stock #32-923
      • I happen to have this lens, so I used it. The lens f/4 is too fast for the Lhires III which is designed for f/10 telescope. When the the iris is closed down to 16 mm diameter (f/10) then the optics is a good match for the Lhires III f/10 design. When the iris is less than 16 mm diameter the spectrum resolution will decrease because the grating is not fully illuminated.
    • Edmund Optics 10mm T-Mount Extension Tube Stock #52-294
    • Baader Varilock T-2 Extension 20-29 mm
    • SCT male to T-mount adapter
    • Agena AstroProducts Blue Fireball # S-SB SCT Thread Spacer Ring with 1" Extension modified to fit on the Lhires III
  • Sony Alpha NEX-6 mirrorless digital camera
    • Imaging Sensor : 16.1MP Exmor APS-C HD CMOS sensor (23.5 X 15.6mm)
    • Still Image Size 16:9 : L: 4912 x 2760
    • Still Image Size 3:2 :4912 x 3264
    • Interchangeable Lens Mount Type: Sony E-mount
    • Sony E-mount to T adapter
    • 5mm T-Mount Extension Tube
  • Astro-Physics Mach1 GoTo mount


Image Processing Software


Camera Alignment

The Sony NEX-6 camera is mounted on the Lhires III so that the absorption lines are vertical. The vertical absorption lines removes the need to tilt the spectrum image during calibration. Tilting the spectrum during calibration reduces the quality of the spectrum.


Image Processing Strategy

The Sony NEX-6 camera saves images in JPG and ARW file formats. JPEG format uses lossy compression that causes artifacts and therefore JPG files are not recommend for quantitative analysis. The Sony ARW file is a raw image format that is used for quantitative analysis.

On my Windows 8.1 laptop RSpec uses the Microsoft Camera Raw Decoder but the decoder decodes ARW image file into an 8-bit image and as a result the 12-bit vertical resolution of the ARW file is not being fully used. The solution is to decode ARW file into a 16-bit image and save the image as a FITS image file in order for RSpec to process the image with 32-bit resolution.

Also, for the most part of the spectrum only one or two of the RGB color channels has the majority of the image data. The other channels have low intensity and noisy image data. Therefore, it is desirable to use only one or two of the RGB color channels to create the monochrome FITS image that will be used by RSpec.


Image Processing Work Flow

  • DCRaw decodes the ARW file into a 16-bit TIFF file
    • dcraw.exe -v -H 0 -o 0 -W -q 0 -4 -T -r 1 1 1 1 -g 1 1 -k 0 -S 65536 DSC02572.ARW
    • CDRaw command line parameters
      • -v verbose information about the processing
      • -H 0 clip the highlights if they happen
      • -o 0 use no color management
      • -W do not automatically brighten the image
      • -q 0 bilinear Bayer filter demosaicing
      • -4 create linear 16-bit file
      • -T create TIFF file
      • -r 1 1 1 1 set custom white balance to all ones
      • -g 1 1 use linear 1.0 gamma correction
      • -k 0 set the black point to 0
      • -S 65536 set the white point to 65536, this provides no scaling (The TIF image values range from 0 to 4095 for the Sony NEX-6 12-bit camera.)
  • ImageJ creates the FITS file from the TIF file.
    • Open the 16-bit TIF file and crop image
    • Convert the GB color channels to a monochrome FITS image.
    • Analyze the 16-bit TIF for over exposure
  • Analyze the 16-bit TIF for background noise
  • RSpec calibrates image and plots spectrum
    • Open the FITS image file
    • Create spectrum plot and synthesize spectrum from the plot data
    • Wavelength calibration
    • Elements documentation
    • Crop spectrum to about 50 Angstroms for best display of the absorption lines.


    Spectrum Calibration

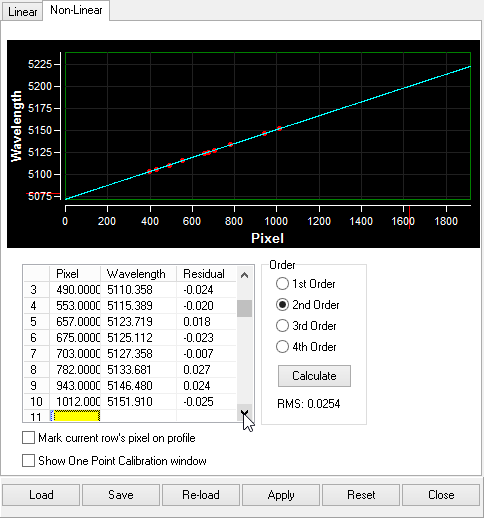
    Spectrum Wavelength Calibration with RSpec V1.7

    Wavelength calibration is replacing the image horizontal pixel number with the spectrum wavelength in Angstroms.

    • RSpec non-linear calibration was used with ten reference absorption lines in the image.
    • The ten reference absorption lines were chosen from the Interactive Database of Spectral Standard Star Atlases
    • In this case, the minimum RMS error is using the 2nd order curve fit as shown in the Calibration Wizard window to the right.


    Sony NEX-6 Camera Image Information

    • Image files: DSC02575.JPG for web display and DSC02572.ARW for spectrum analysis
      • JPG is used with IrfanView to view, crop, resize and select best image for web page.
      • ARW is used with RSpec for spectrum processing
    • Image size: 4912 x 2760
    • Image cropped in center: 660 for ~50 Angstroms
    • DSC02575.JPG exposure: 1/3200 seconds
    • DSC02572.ARW exposure: 1/400 seconds
    • ISO: 100
    • White balance: Daylight
    • Creative Style: Standard
    • Contrast: Normal
    • Saturation: Normal
    • Sharpness: Normal
    • DRO / Auto HDR: Off
    • Manual Focus Assist: On
    • Color space: sRGB
    • Release without lens: Enable
    • Long Exposure NR: On
    • High ISO NR: Normal
    • Custom Key Settings: Soft key B Setting: MF assist


    Sun Spectrum Data (RSpec V1.7)

    • RSpec V1.7 data DAT file with layout INI file and custom elements DAT file (Sun5100to5150.zip)
    • The custom elements DAT file is put in the RSpect ElementsCustom directory.
    • The data DAT file with its layout INI file is put in the same directory and is open with RSpec Open Profile.
    • Open RSpec Elements and check the Sun with Angstrom range to display the elements reference lines.
    • The INI file is the layout INI file.


    Observing Information

    • OBS-Location: Camas, WA USA, 16.6 miles East-North-East from the center of Portland, OR.
    • DATE-Local = 9/14/2014, 11:39:46 PDT.


    Links

    Sun Spectroscopy Images

    Sun Spectroscopy

    Sun Spectroscopy Atlases

    Sun Fraunhofer Lines

    Spectroscopy