|
The Sun radio emission burst was observed with three instruments.

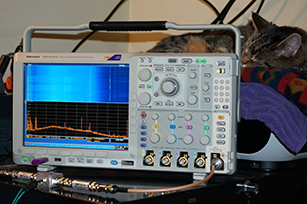
Tektronix MDO4104-6 Spectrum Analyzer Video
Tektronix MDO4104-6 Spectrum Analyzer
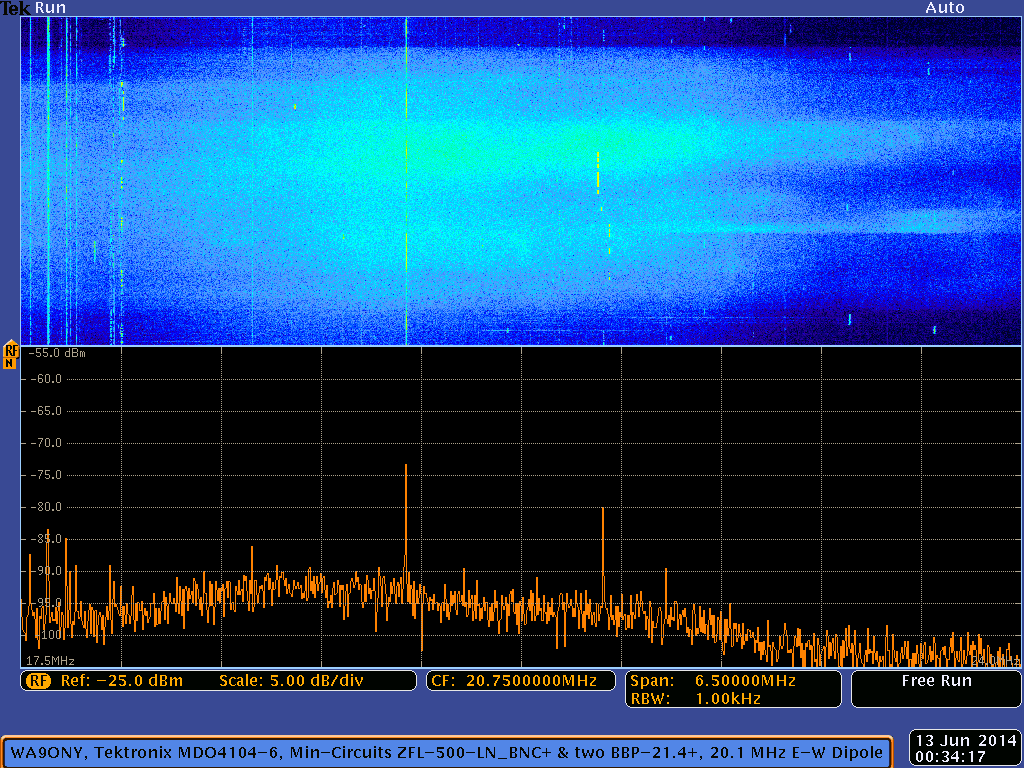
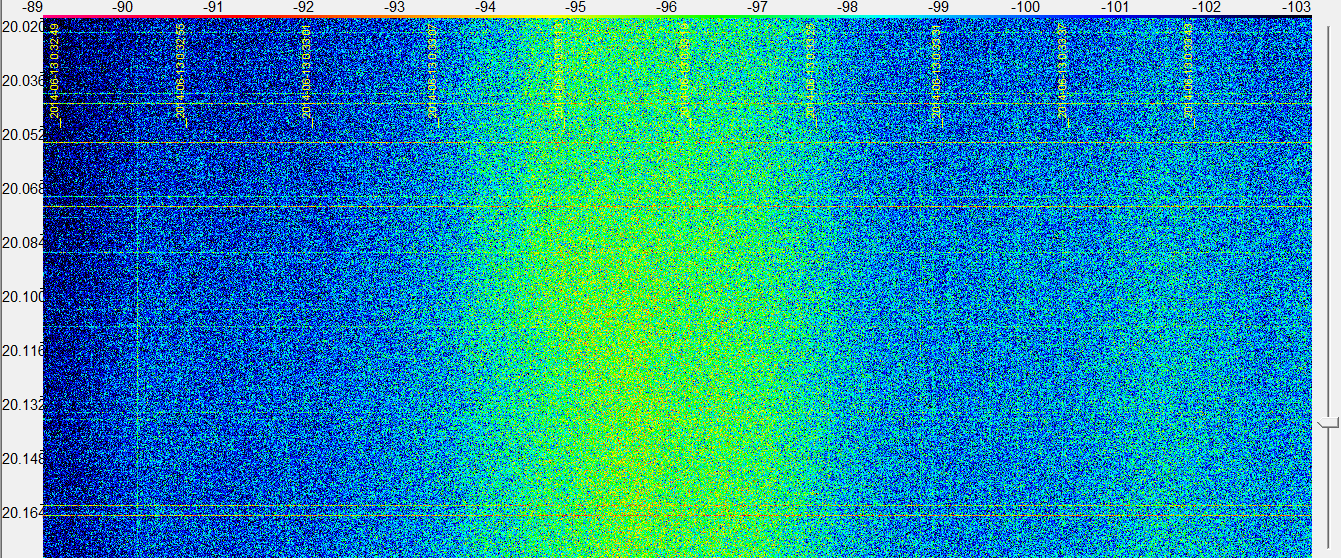
- The below Tektronix MDO4104-6 spectrum analyzer display shows the Sun radio emissions from 17.5 MHz to 24.0 MHz.
- The Sun radio emission is the white blueish color in the top blue spectrogram window.
- Radio stations
- The first set of strong vertical signals from the left edge are the 17.5 MHz to 17.9 MHz broadcasting stations.
- The second set of strong signals from the left edge are the
17 meter (18.068 MHz to 18.168 MHz) amateur radio band.
- Radio station WWV at 20.0 MHz
is the white vertical line in the spectrogram just over one division left of center.
- WWV distance is 1,511 km with a bearing of 105.3 degrees.
- The strong set of signals just right of the center frequency is the
15 meter
(21.0 MHz to 21.45 MHz) amateur radio band.
- The short thin horizontal lines in the spectrogram are weak lighting or weak RFI bursts.
- The antenna sensitivity peaks on the left side of the spectrogram.
- This results in the background noise being a lighter blue color on the left side of the spectrogram.
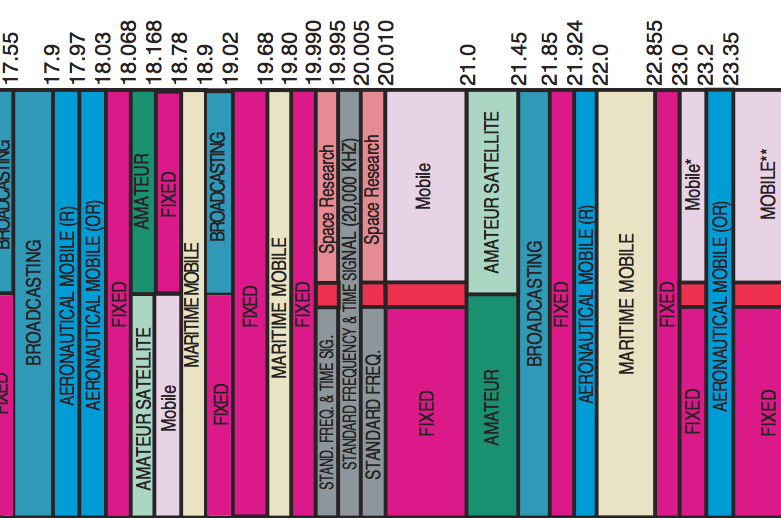
United States Frequency Allocations
Sun Location
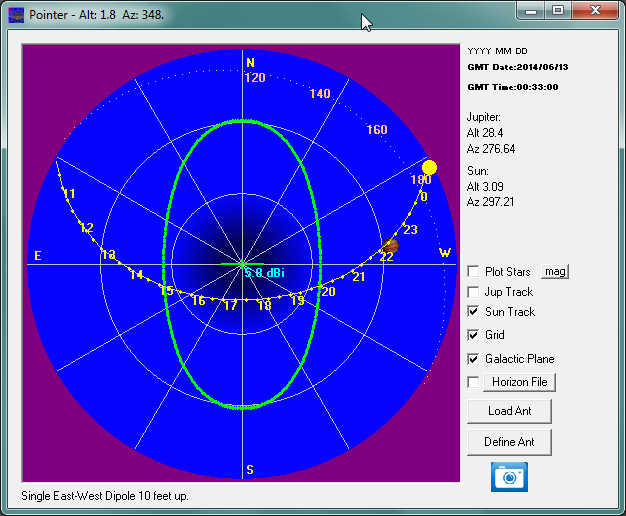
The Sun was only 3.09 degrees above the horizon when the solar radio emission occurred.
Tektronix MDO4104-6 Spectrum Analyzer Settings
- Spectrum analyzer is the bottom window
- 17.5 MHz start frequency
- 20.75 MHz center frequency
- 24.0 MHz stop frequency
- 6.5 MHz frequency span
- 6.5 MHz capture bandwidth
- 1 kHz resolution bandwidth
- 650 kHz per horizontal division
- 5 dBm per vertical division
- Spectrogram (waterfall) is the top window
- Spectrogram bottom is the current spectrum trace shown at the bottom of the display.
- Spectrogram top is the oldest spectrum, approximately 1 minute and 45 seconds after the current spectrum trace at the bottom.
- 328 spectrums in the spectrogram.
- 0.32 seconds per spectrum update rate.
- 3.12 spectrums per second update rate.
- Date and time in lower right corner is in UT.
- Python 2.7.6 script taking screen captures every 12 seconds
|
|
Spectrum Analyzer Equipment
SDR-IQ Receiver Video
RFSpace
SDR-IQ Receiver
RTL-SDR Receiver Video
RTL-SDR Receiver
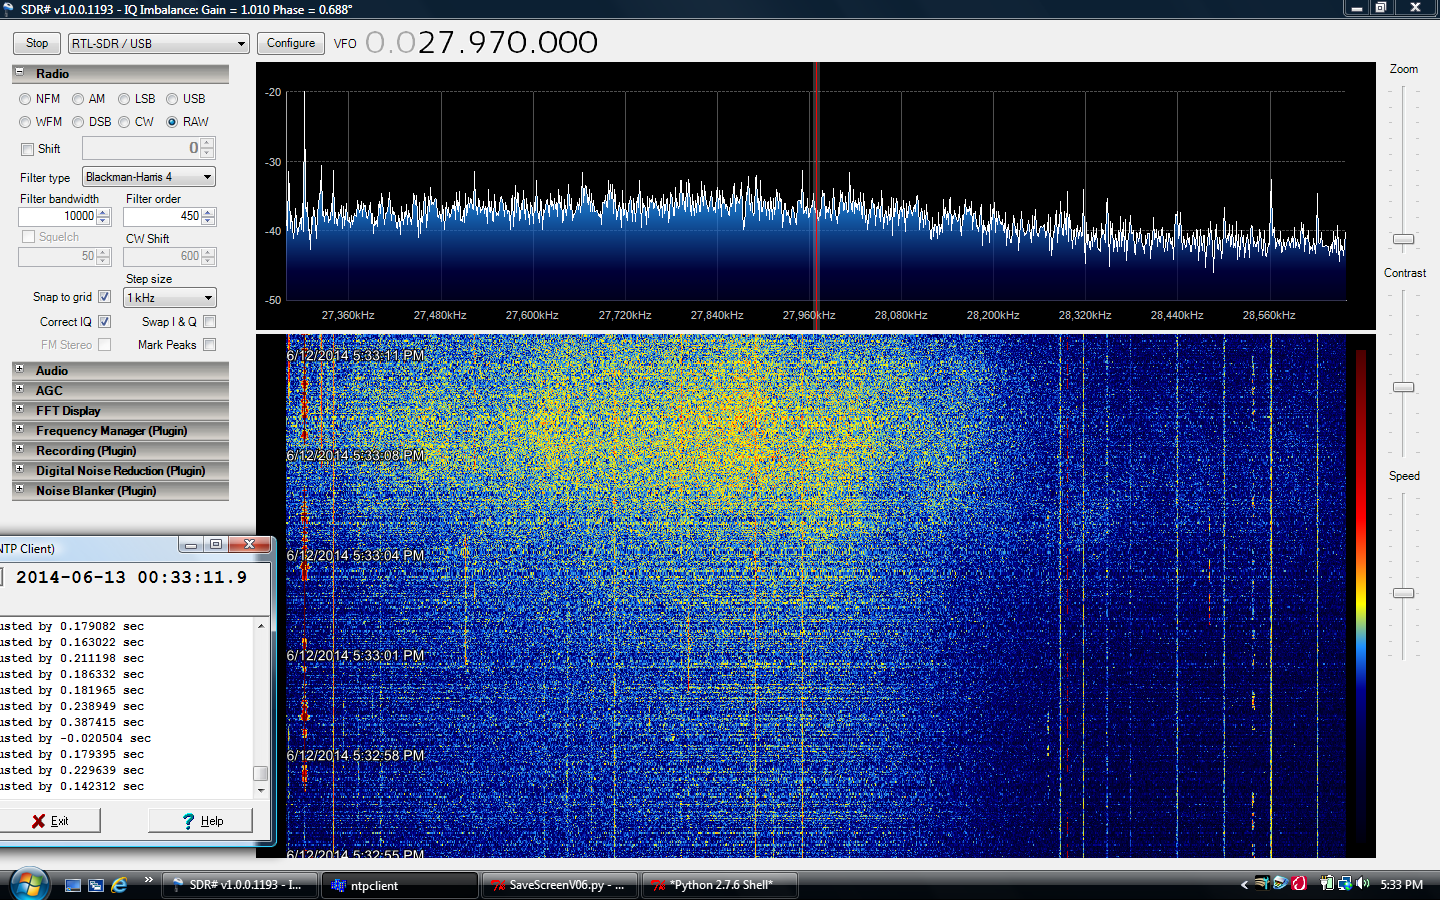
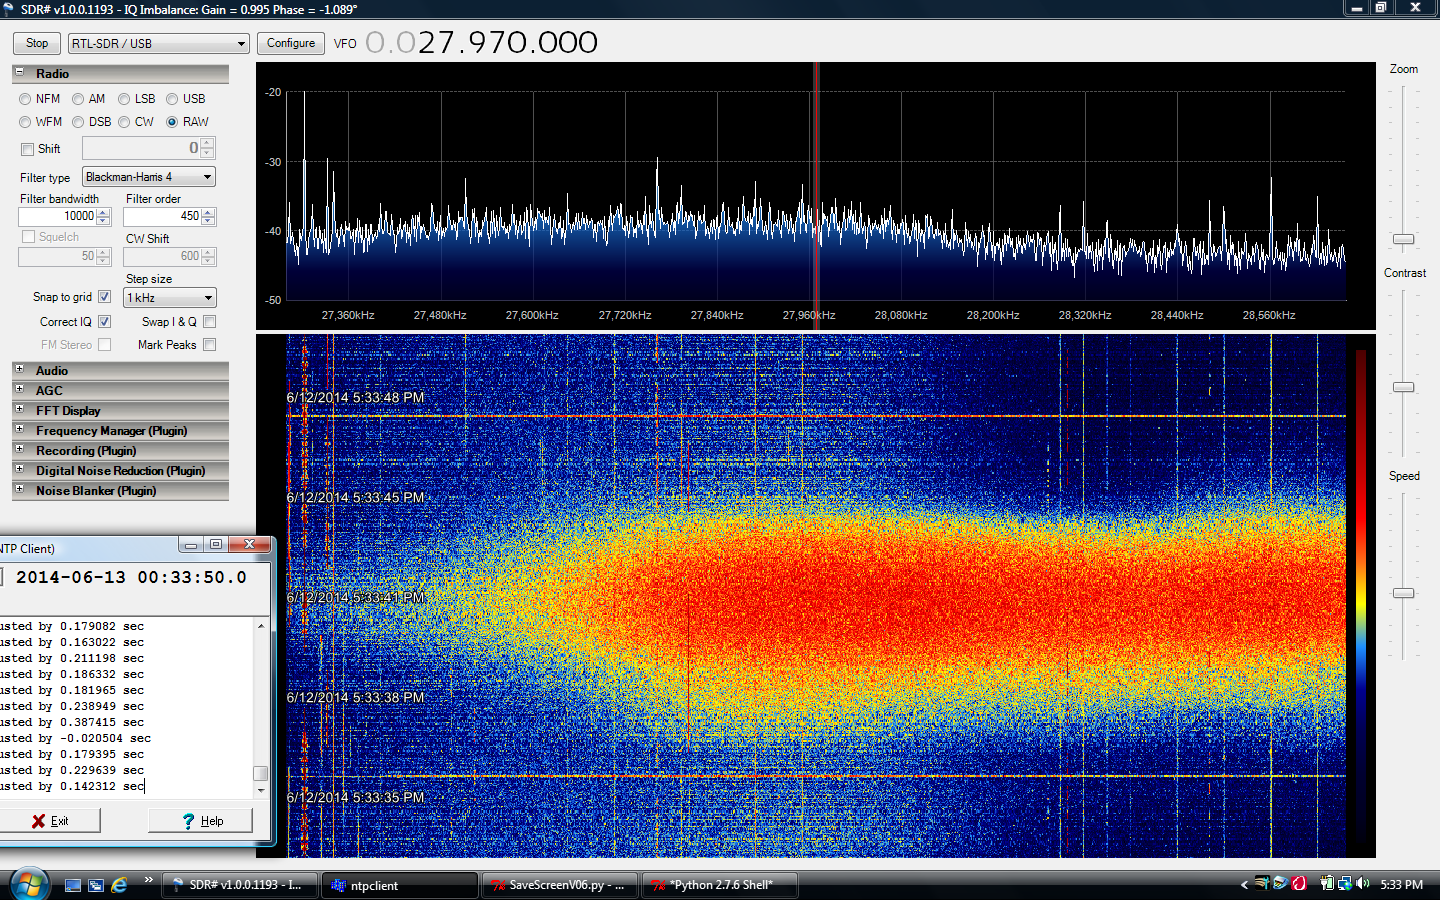
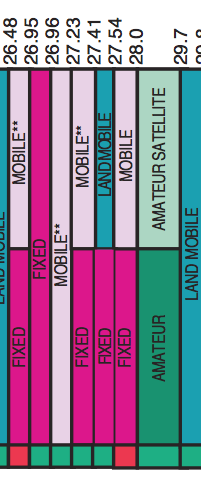
- Below is SDR# spectrum analyzer display showing the Sun radio emissions from approximately 26.240 MHz to 28.680 MHz.
- The Sun radio emission is the yellow-red noise in the spectrogram window.
- Spectrogram top is the current spectrum trace shown in the top window.
- Spectrogram bottom is the oldest spectrum, approximately 16 seconds after the current spectrum trace at the top.
- 3 to 4 seconds between spectrogram vertical time stamps
- The signals on the left side are the
Citizens band radio (CB radio) (26.965 MHz to 27.405 MHz).
- The signals on the right are the
10 meter
(28.0 MHz to 29.7 MHz) amateur radio band.
United States Frequency Allocations
The Radio Spectrum, October 2003
U.S. DEPARTMENT OF COMMERCE
National Telecommunications and Information Administration
|
|
Hardware Equipment
- Radio: NooElec NESDR Mini SDR & DVB-T USB Stick (R820T) based on the Realtek RTL2832U and the Raphael Micro R820T
- A preselector is used to remove the strong stations from overloading the SDR.
- Antenna: Scanner Ant-Base 30-1300 Mhz by Antennacraft, includes 50 feet of RG-6
- Laptop: HP G70 NOtebook PC, Pentium Dual Core CPU, T4200 @ 2.00 GHz, 3 GB RAM, 32-bit
- Data logging to Toshiba 2TB USB hard drive
Software
Observing Information
- OBS-Time: June 13, 2014, 0033 UT
- OBS-Location: Camas, WA USA, 16.6 miles East-North-East from the center of Portland, OR, USA
Radio JOVE Data Archive Calendar
Verifying Solar Burst
NOAA/ National Weather Service
National Centers for Environmental Prediction
Space Weather Prediction Center
Solar Event Reports (Edited Events)
gt:Product: 20140613events.txt
:Created: 2014 Jun 14 1802 UT
:Date: 2014 06 13
# Prepared by the U.S. Dept. of Commerce, NOAA, Space Weather Prediction Center
# Please send comments and suggestions to SWPC.Webmaster@noaa.gov
#
# Missing data: ////
# Updated every 30 minutes.
#                            Edited Events for 2014 Jun 13
#
#Event    Begin    Max       End  Obs  Q  Type  Loc/Frq   Particulars       Reg#
#-------------------------------------------------------------------------------
3640 +     0029   0033      0044  LEA  3   FLA  S22E63    SF      DSD       2092

3660       0030   0034      0041  G15  5   XRA  1-8A      C8.5    3.8E-03   2087
3660 +     0031   0034      0056  LEA  3   FLA  S19E45    1F      ERU       2087
3660       0032   ////      0034  LEA  C   RSP  025-180   V/2               2087
3660 +     0033   ////      0034  CUL  C   RSP  018-200   III/3             2087

Obs   - The reporting observatory.
        CUL - Culgoora, Australia
        HOL - Holloman AFB, NM, USA    LEA - Learmonth, Australia
        PAL - Palahua, HI, USA         RAM - Ramey AFB, PR, USA
        SAG - Sagamore Hill, MA, USA   SVI - San Vito, Italy

Q     - Quality
        For radio bursts at fixed and sweep frequencies, and for storms, this
        shows the quality of the data
                       C = Corrected report
                       G = Good
                       U = Uncertain
        For optical flares, this shows the quality of observing conditions,
        from 1 to 5, where:  1 = very poor and 5 = excellent

        X-ray events and SXI flare have a quality of 5 (meaning excellent).


Type  - Type of report, see http://www.swpc.noaa.gov/info/glossary.html
          BSL = Bright surge on the limb
          DSF = Filament disappearance
          EPL = Eruptive prominence on the limb
          FIL = Filament
          FLA = Optical flare observed in H-alpha
          FOR = Forbush decrease (cosmic ray decrease))
          GLE = Ground-level event (cosmic ray increase)
          LPS = Loop prominence system
          PCA = Polar cap absorption
          RBR = Fixed-frequency radio burst
          RNS = Radio Noise Storm
          RSP = Sweep-frequency radio burst
          SPY = Spray
          XFL = SXI X-ray flare from GOES Solar X-ray Imager (SXI)
          XRA = X-ray event from SWPC's Primary or Secondary GOES spacecraft

   RSP:
    Type/Intensity
	Type  II: Slow drift burst
	Type III: Fast drift burst
	Type  IV: Broadband smooth continuum burst
	Type   V: Brief continuum burst, generally associated with Type III bursts
	Type  VI: Series of Type III bursts over a period of 10 minutes or more,
	           with no period longer than 30 minutes without activity
	Type VII: Series of Type III and Type V bursts over a period of 10 minutes
	           or more, with no period longer than 30 minutes without activity
	Type CTM: Broadband, long-lived, dekametric continuum

	Intensity is a relative scale 1=Minor, 2=Significant, 3=Major
|
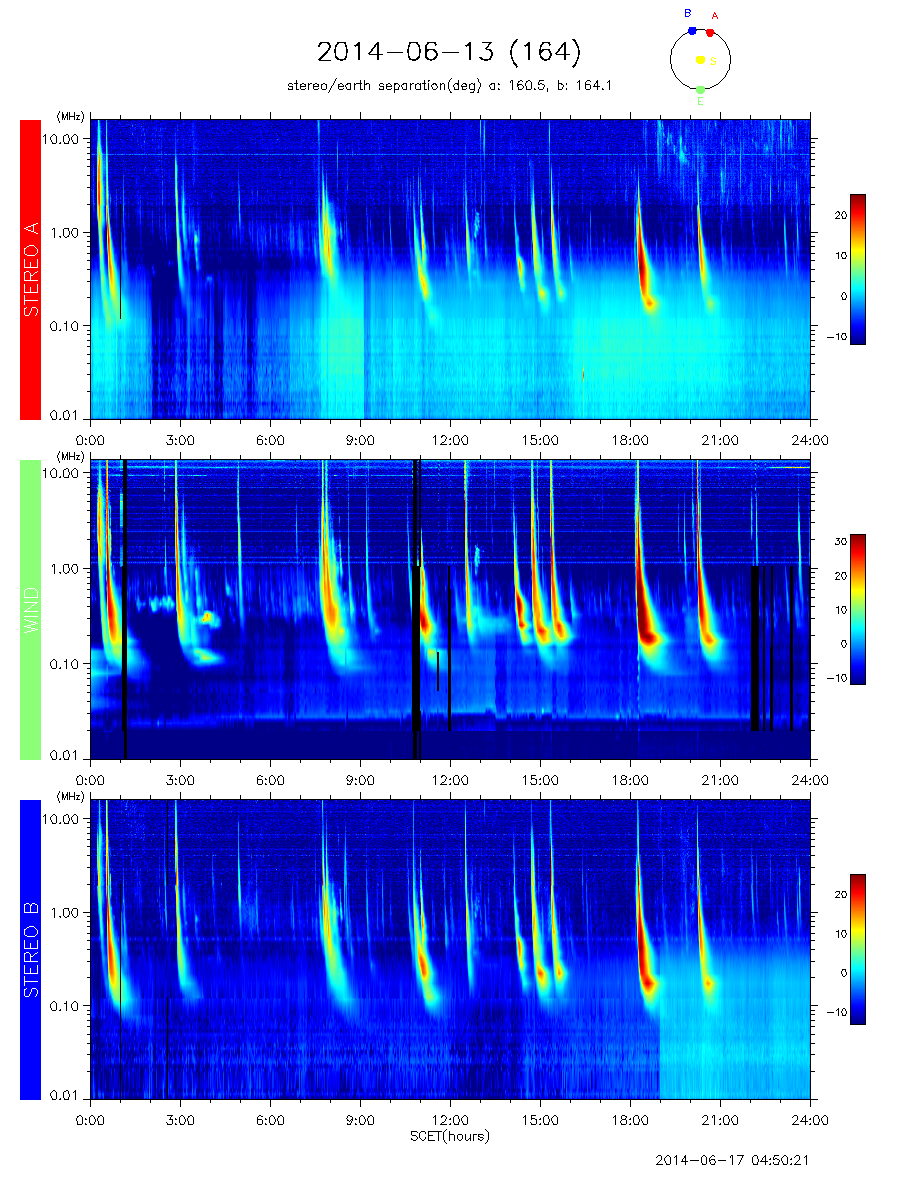
NASA STEREO / WAVES
NASA WIND-WAVES: The Radio and Plasma Wave Investigation on the WIND Spacecraft
NASA STEREO (Solar TErrestrial RElations Observatory)
NASA STEREO / WAVES data

|