<<PREVIOUS -
HOME -
CONTENTS -
NEXT>>
PMO INDEX -
![]()
Star Vega Spectrum

|
<<PREVIOUS -
HOME -
CONTENTS -
NEXT>>
PMO INDEX -
![]()
|
|
|
In the above image star Vega round spectral order zero is in the upper left corner and it's first order blazed grating spectrum is located on the top to the right side. The processed spectrum band is below the blazed grating spectrum.
Spectroscopy Team The spectrum image was taken by the below spectroscopy team:
|
|
|
Spectrum Selection |
|
|
|
|
Spectrum 3-D Surface Plot 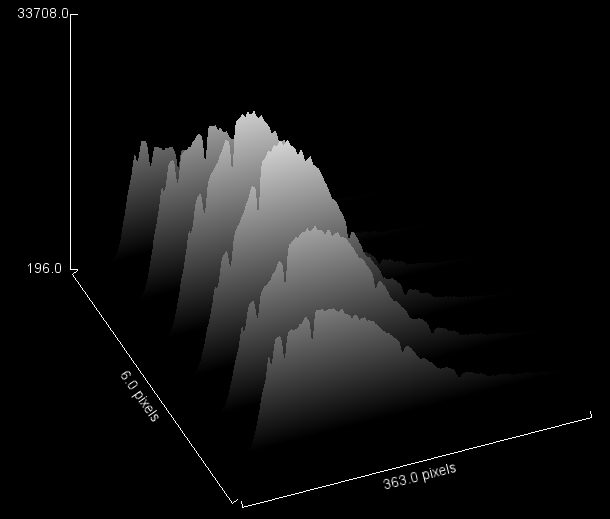
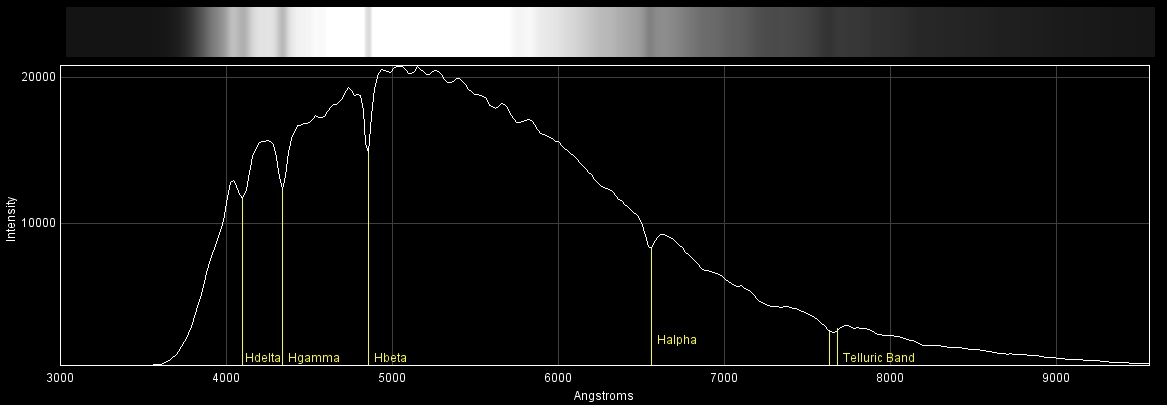
Spectrum Band
|
|
Spectrum Chart
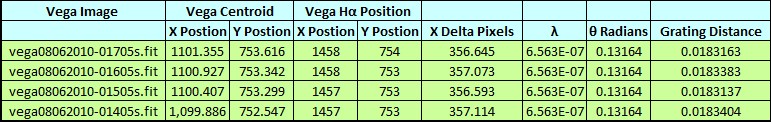
Spectrum Calibration
Signal to Noise Ratio
The background measurements are of the above yellow selection box.
Monitor Test PatternThe following test pattern is to help you adjust your monitor to best view the CCD astro images. The test pattern is used for adjusting monitor brightness, and contrast. Adjust monitor brightness and contrast to see all 16 gray scale levels. The most important adjustment when viewing astro images is to see the differences in all of the black bands. |