<<PREVIOUS -
HOME -
CONTENTS -
NEXT>>
SUN SPECTRUM INDEX -
![]()
Sun Spectrum
5150 to 5200 Angstroms
Magnesium Triplet Absorption Lines

|
<<PREVIOUS -
HOME -
CONTENTS -
NEXT>>
SUN SPECTRUM INDEX -
![]()
|
|
|
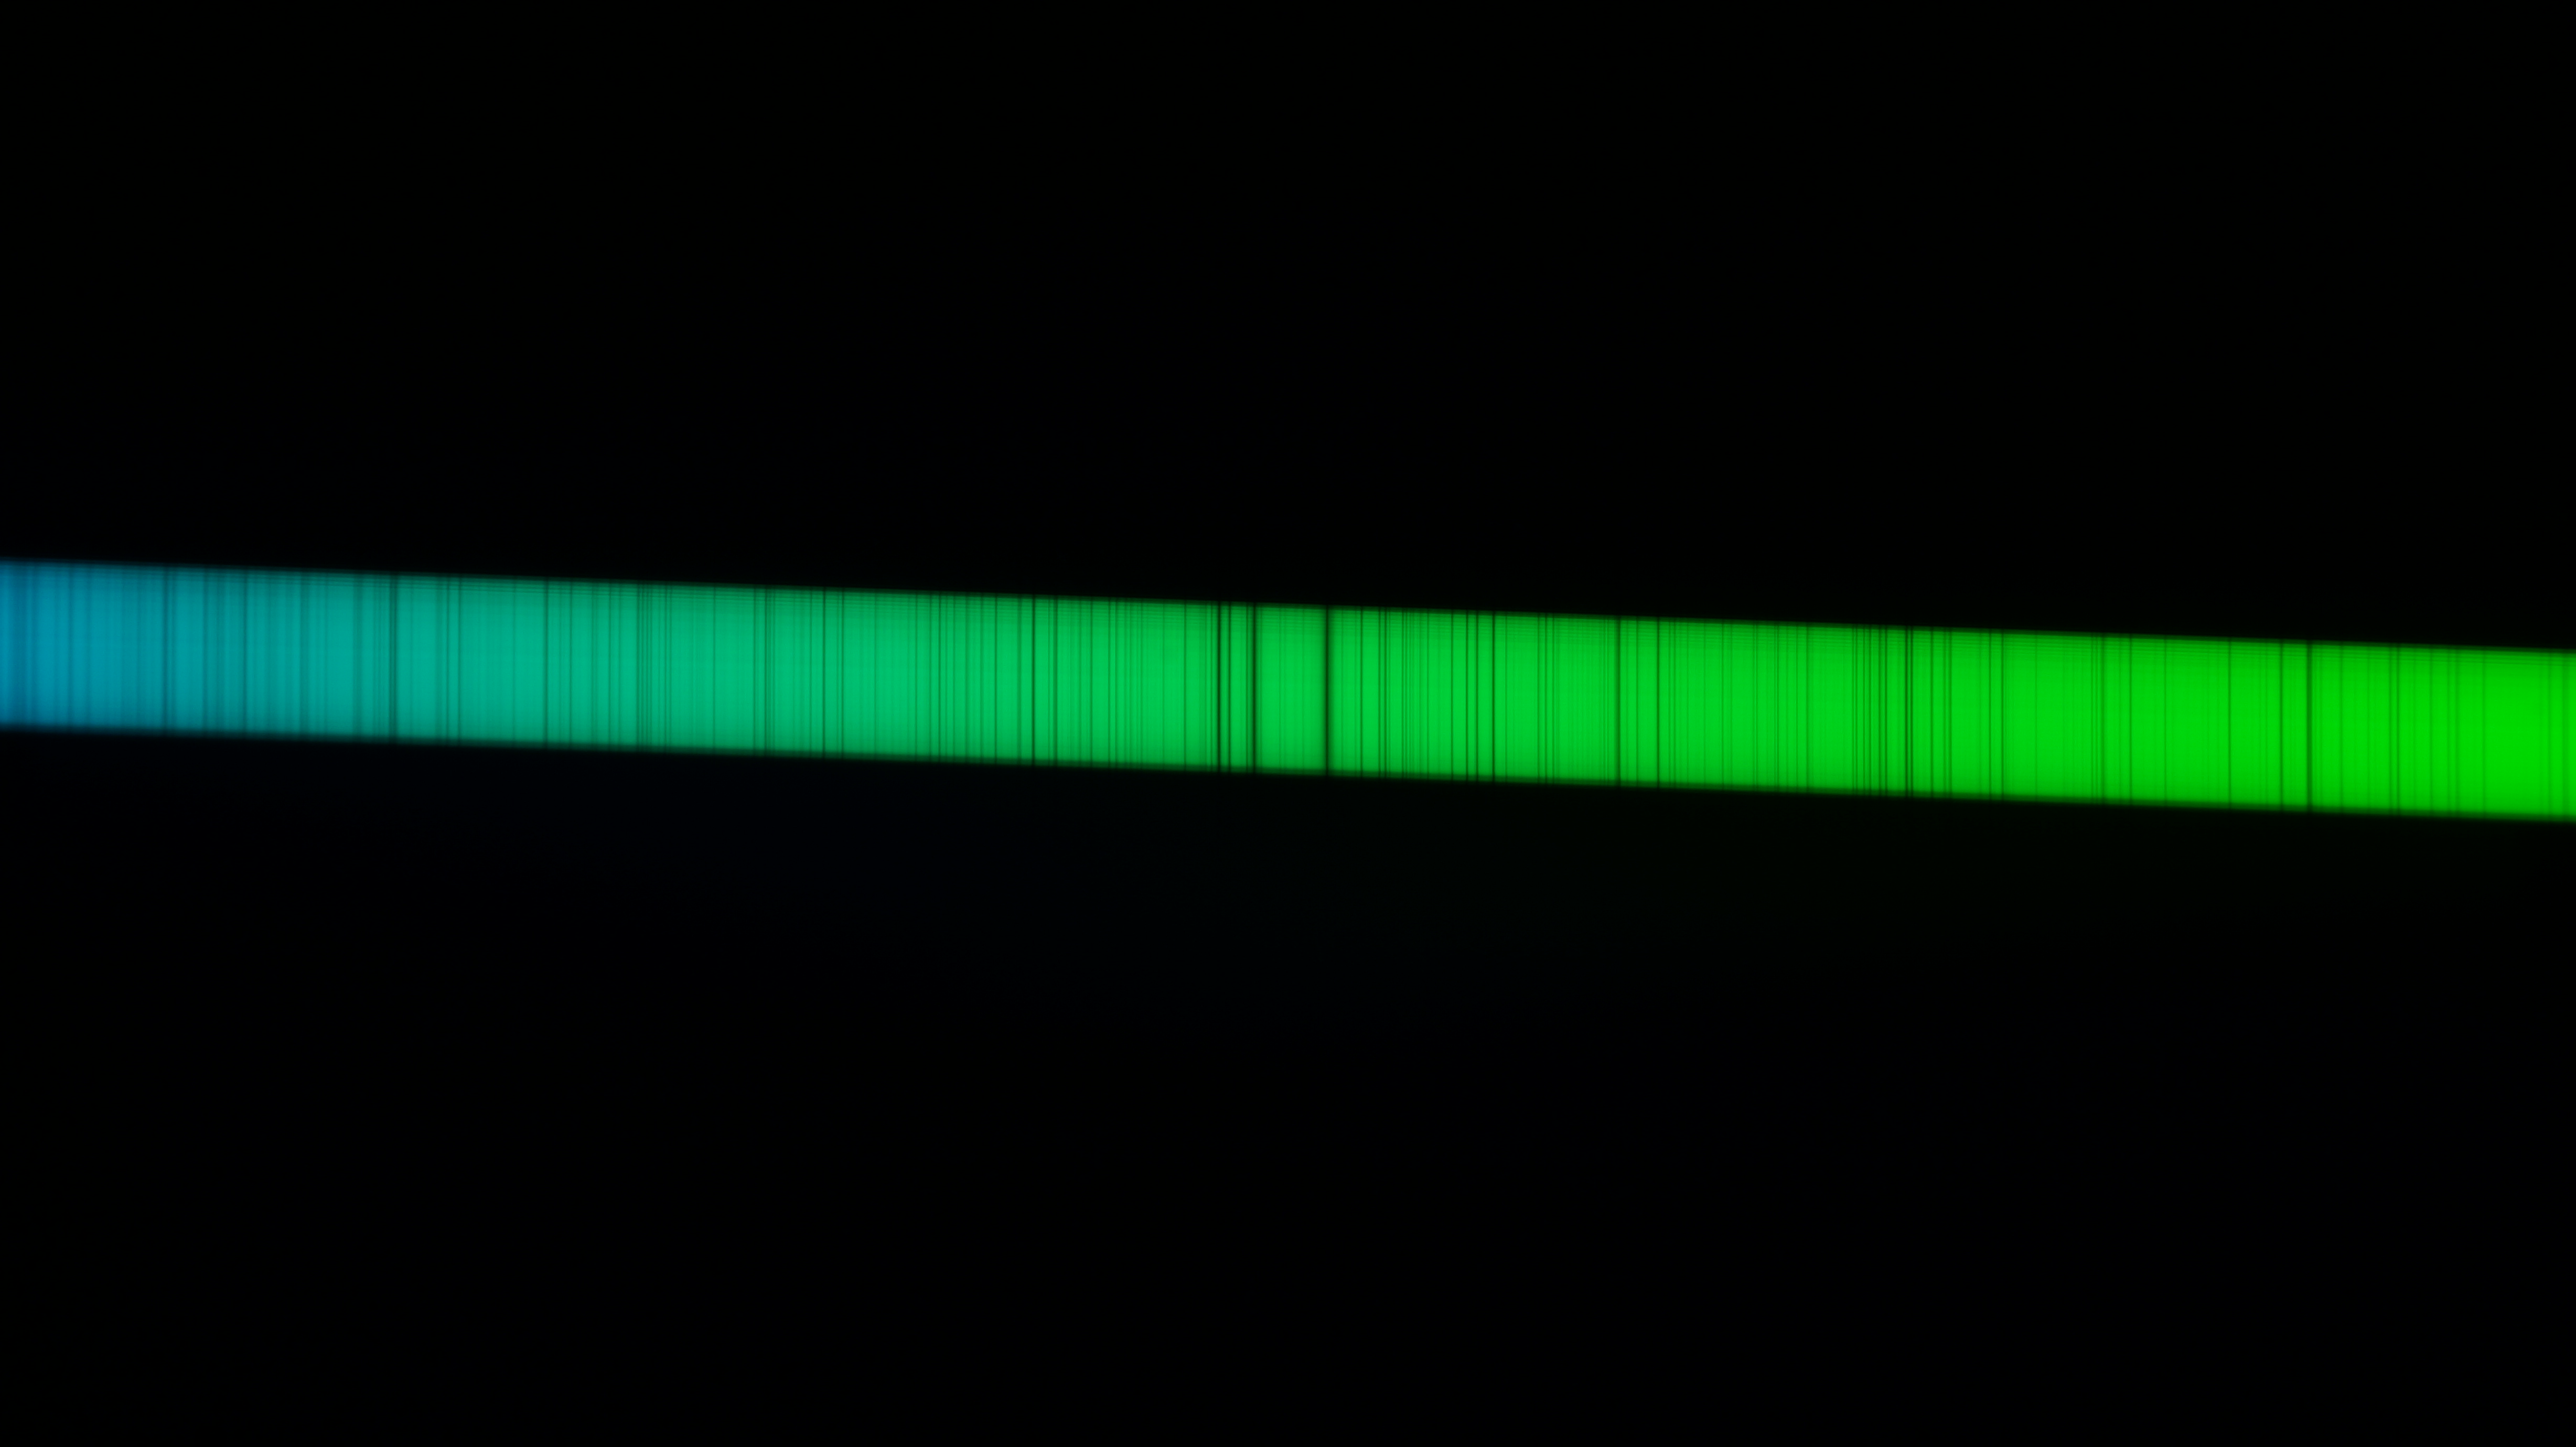
Summary The above sunlight spectrum is 100% scale image and the image is cropped for a span of ~50 Angstroms. Thirty-three vertical absorption lines are identified that represents six different elements. As for the data quality the photon noise SNR is very good at 758 SNR and an absorption line FWHM was measured at 0.2930 Angstroms. Measured spectrograph resolution R is 17,607. Sony NEX-6 Camera Image The below image is vertically cropped and it is 25% size of the full image size of 4912 x 2760. The Sony NEX-6 camera auto rotate cannot be turned off. Therefore, the full scale image may be rotated when displayed. The camera is mounted on the spectrograph so that the dark absorption lines are vertical. The focus is soft at both ends of the spectrum and only the center portion of the spectrum image is used for analysis.
YouTube Videos
The Sun's visible spectrum is light that is spread out and it is measured by its wavelength and intenstiy. By analyzing the absorption lines in the spectrum we can determine the elements in the Sun's photosphere. Absorption spectroscopy is based on Gustav Kirchhoff's laws of spectroscopy. First, the core of the Sun is hot and it produces light with a continuous spectrum. Secondly, this light with a continuous spectrum travels through parts of Sun's photosphere which have a gas that absorbs light at specific wavelengths depending upon the elements in the gas and the elements atomic energy states. By comparing the absorption spectral lines in a lab on Earth with the Sun's absorption spectral lines we can determine the elements in the Sun. Light is a form of electromagnetic radiation. Two properties of electromagnetic radiation is frequency f and wavelength λ. The electromagnetic radiation frequency and wavelength are related by the speed of light c = f * λ. A photon is a quantum of light. The energy and momentum of a photon is equal to the frequency times Planck constant. As a result, different frequencies (different wavelengths) have unique different energies. The energy levels of atoms are discrete. To move between atomic energy levels requires the addition or removal of the energy difference between the two energy levels. For example, one way to increase the atom's energy level is for the atom to absorb a photon that has the same energy as the energy difference between two energy levels. This is what happens when creating an absorption line. In other words, atoms absorb photon at only specific energy levels that results in the atom's increase in energy. An emission line is when the atom's energy level decreases and a photon is emitted from the atom with the same energy. In other words, atoms emit photons at only specific energy levels that results in the atom's decrease in energy. For more information see
Solar Spectrum Charts The below solar spectrum charts span ~50 Angstroms in the horizontal axis. There are 660 horizontal data points. The red points are the data points from the image pixels and pixels are 0.0788 Angstroms/pixel. The vertical axis is uncalibrated light intensity and it is the sum of the light intensity in the image columns. The spectrum below the plot is synthesize from the plot data. 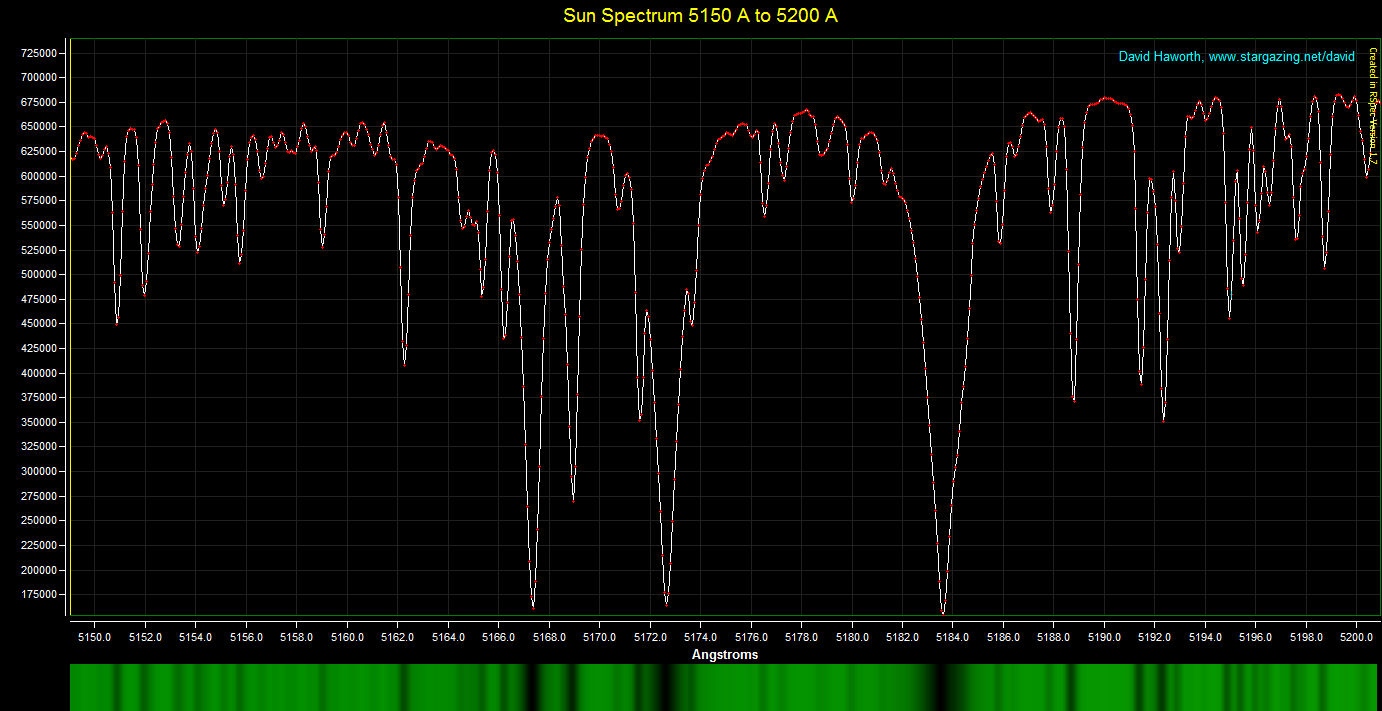
Elements Identified in this Sun Spectrum Plot by Their Absorption Lines
The source for the above elements is KPNO FTS The Sun Disk Averaged 1981 Normalized Flux Solar rest wavelengths from The Interactive Database of Spectral Standard Star Atlases. Element Symbol and Name Degrees of Ionization of Atoms
The below plot shows the location of the element absorption lines in the Sun's spectrum. 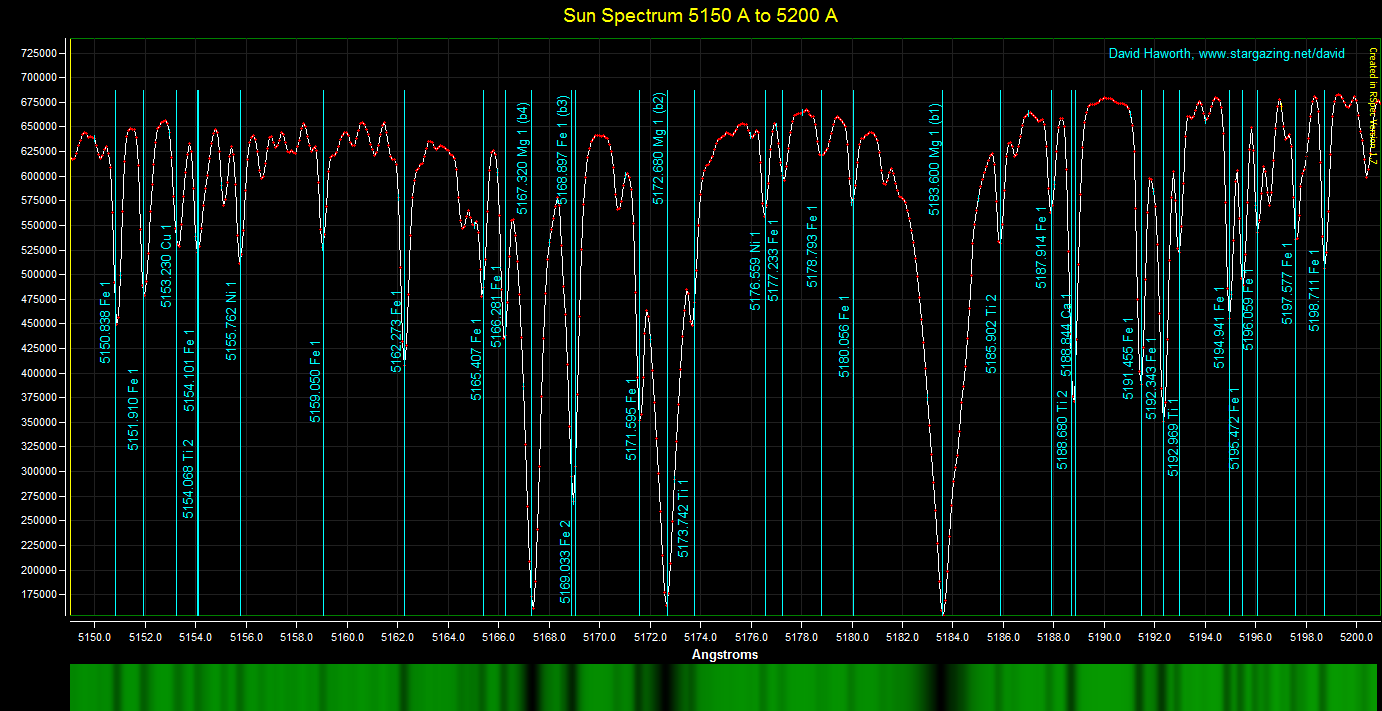
Sun Spectrum Image Scaled The below spectrum image was scaled by IrfanView to match above spectrum plot. The absorption lines in the scaled spectrum image matches the synthesize spectrum from the plot data.

|
||||||||||
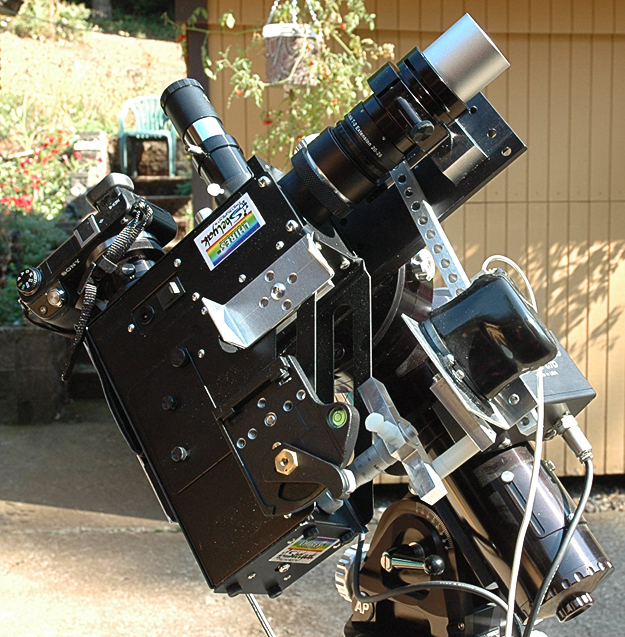
Equipment
Image Processing Software
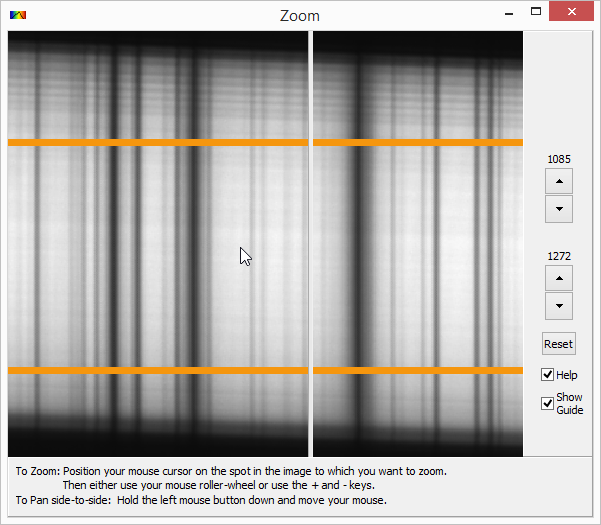
Camera Alignment The Sony NEX-6 camera is mounted on the Lhires III so that the absorption lines are vertical. The vertical absorption lines removes the need to tilt the spectrum image during calibration. Tilting the spectrum during calibration reduces the quality of the spectrum. The zoom screen capture to the right shows white slit guide on a zoomed part of the spectrum image. The dark absorption lines are parallel with the slit guide indicating that the camera alignment on the Lhires III is good. RSpec Vertical Summing of Image Values RSpec sums the image vertical pixels to create the intensity data for the spectrum plot. During calibration you select the region for analysis on the image with upper and lower horizontal guides. The zoom window to the right shows the two yellow horizontal guides. The top guide is at image row 1085 and the bottom guide is at image row 1272. The vertical pixels in the column in between the guides are added to create the spectrum plot intensity for each column. In this case 187 pixels are added. The maximum pixel value for the Sony NEX-6 is 4095 (the maximum for 12-bit number). 187 pixels times 4095 maximum value equals 765,765 which is the maximum value for the 187 pixels added together. In the spectrum plot the maximum spectrum intensity is 682,744 which indicates that there is not a column of fully saturated pixels in the spectrum plot and in the spectrum image. The maximum spectrum intensity 682,744 divided 187 equals 3651 which is 89% below the saturated value of 4095. This is another check that the image was not over exposed. Image Processing Strategy The Sony NEX-6 camera saves images in JPG and ARW file formats. JPEG format uses lossy compression that causes artifacts and therefore JPG files are not recommend for quantitative analysis. The Sony ARW file is a raw image format that is used for quantitative analysis. On my Windows 8.1 laptop RSpec uses the Microsoft Camera Raw Decoder but the decoder decodes ARW image file into an 8-bit image and as a result the 12-bit vertical resolution of the ARW file is not being fully used. The solution is to decode ARW file into a 16-bit image and save the image as a FITS image file in order for RSpec to process the image with 32-bit resolution. Also, for the most part of the spectrum only one of the RGB color channels has the majority of the image data. The other two channels have low intensity and noisy image data. Therefore, it is desirable to use only one of the RGB color channels to create the monochrome FITS image that will be used by RSpec. Image Processing Work Flow
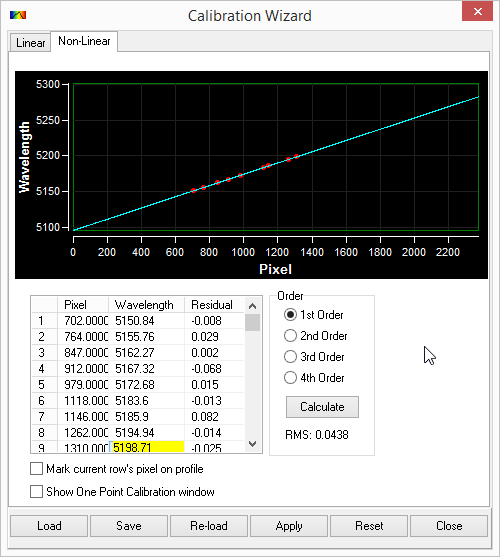
Spectrum Wavelength Calibration with RSpec V1.7 Wavelength calibration is replacing the image horizontal pixel number with the spectrum wavelength in Angstroms.
Sony NEX-6 Camera Image Information
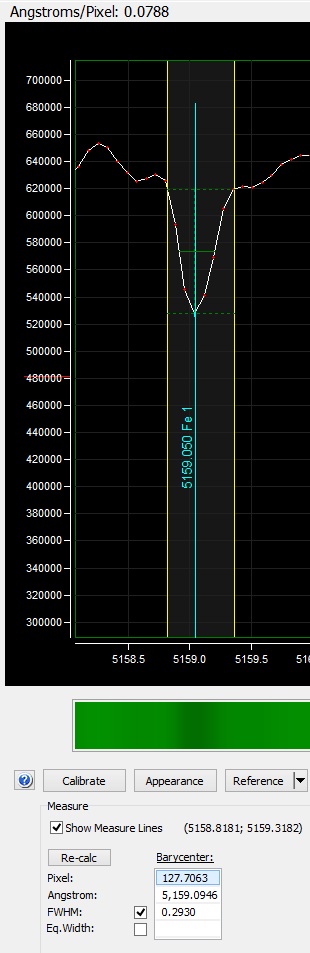
Full Width at Half Maximum (FWHM) Analysis FWHM is a measure of the absorption line spectral width and it is used for measuring the resolution of the spectrum. In the screen capture to the right the FWHM of the 5159.050 Fe 1 absorption line is 0.2930 Angstroms as measured by RSpec. Measured spectrograph resolution R equals the wavelength/FWHM. For more information see
Photon Noise Analysis Photon noise (shot noise) is the fluctuations in the rate of arrival of light captured by the camera. The
standard deviation
of the photon noise is equal to the square root of the spectrum intensity. The standard deviation is also equal to the Photon Noise
signal-to-nose ratio (SNR). It is desired to have the SNR > 100. The spectrum has 660 data points. The below table shows the mean, median, minimum and maximum of the 660 data points with the standard deviation and SNR. The SNR ranges from 139.42 to 194.77 which is very good.
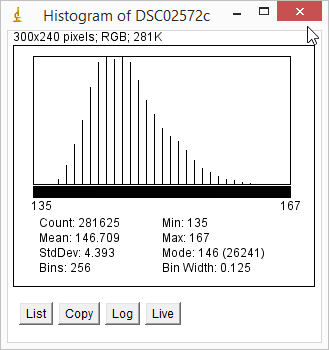
Image Background Noise Analysis ImageJ analysis of the spectrum image background where there is no spectrum light is shown to the right. The background mean is 146.709 and the background is not zero which means the ARW conversion to TIF worked well and it did not clip the black point. It is normal for CCD cameras to have a small offset above zero. The background noise standard deviation is 4.393. The background noise of 4.393 is not visibility detectable on the spectrum plot with the vertical intensity scale of 25,000 per vertical division. Sun Spectrum Data (RSpec V1.7)
Observing Information
Sun Spectroscopy Images
Sun Spectroscopy
Sun Spectroscopy Atlases
Sun Fraunhofer Lines
Spectroscopy
|