<<PREVIOUS -
HOME -
CONTENTS -
NEXT>>
SPECTROSCOPY INDEX -
![]()
<<PREVIOUS -
HOME -
CONTENTS -
NEXT>>
SPECTROSCOPY INDEX -
![]()
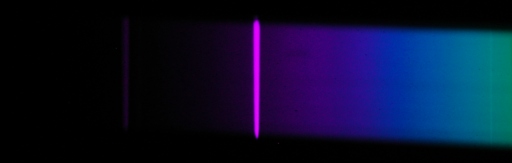
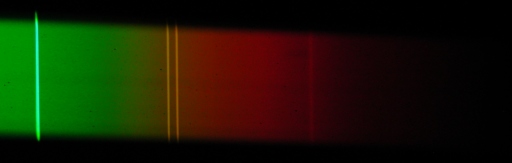
These are the first Spectra L200 bench test spectrums.
The spectrums are of a hand held five inch fluorescent (Satellite F4T5D) light taken with an unpainted Spectra L200. The fluorescent light uses excited mercury atoms and therefore the spectrum has strong mercury emission lines
The bright and colorful mercury emission lines make it easy to identify the wavelengths for the micrometer settings.
There is a very faint cyan emission line in the spectrums below.
See the Spectrum of Mercury Gas Discharge for a colorful spectrum diagram that helps to identify the emission lines below.
The camera is a very old Nikon Coolpix 990 Digital Camera afocal coupling to an eyepiece (STWA18 Wide Angle 18mm Eyepiece/Adapter ) with built in adapter threads to the camera.
Short wavelengths are on the left side of the spectrum and long wavelengths are on the right side of the spectrum. The spectrum images are one quarter size and cropped from the original images.
Micrometer Setting: 22.15
4046.563 Ĺ and 4358.328 Ĺ -
Violet
Emission Lines
|
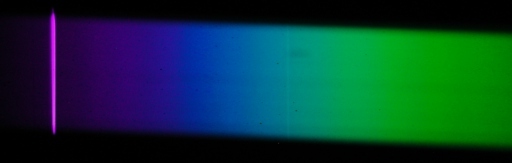
Micrometer Setting: 22.00
4358.328 Ĺ -
Violet
Emission Line
|
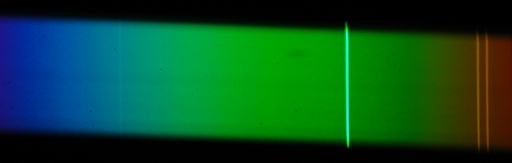
Micrometer Setting: 21.85
5460.735 Ĺ -
Green
5769.598 Ĺ
and
5790.663 Ĺ -
Yellow,
Emission Lines
|
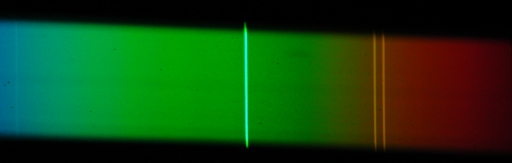
Micrometer Setting: 21.70
5460.735 Ĺ -
Green
5769.598 Ĺ
and
5790.663 Ĺ -
Yellow,
Emission Lines
|
Micrometer Setting: 21.55
5460.735 Ĺ -
Green
5769.598 Ĺ
and
5790.663 Ĺ -
Yellow
6149.475 Ĺ - red Emission Lines
|
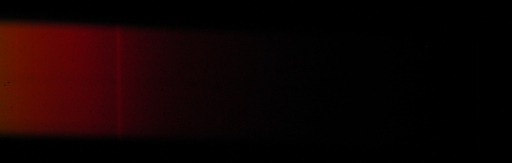
Micrometer Setting: 21.40
6149.475 Ĺ - red Emission Line
|
Spectra L200 Spectrograph