|
The Sun radio emission burst was observed with these instruments.

Tektronix MDO4104-6 Spectrum Analyzer Video
Tektronix MDO4104-6 Spectrum Analyzer
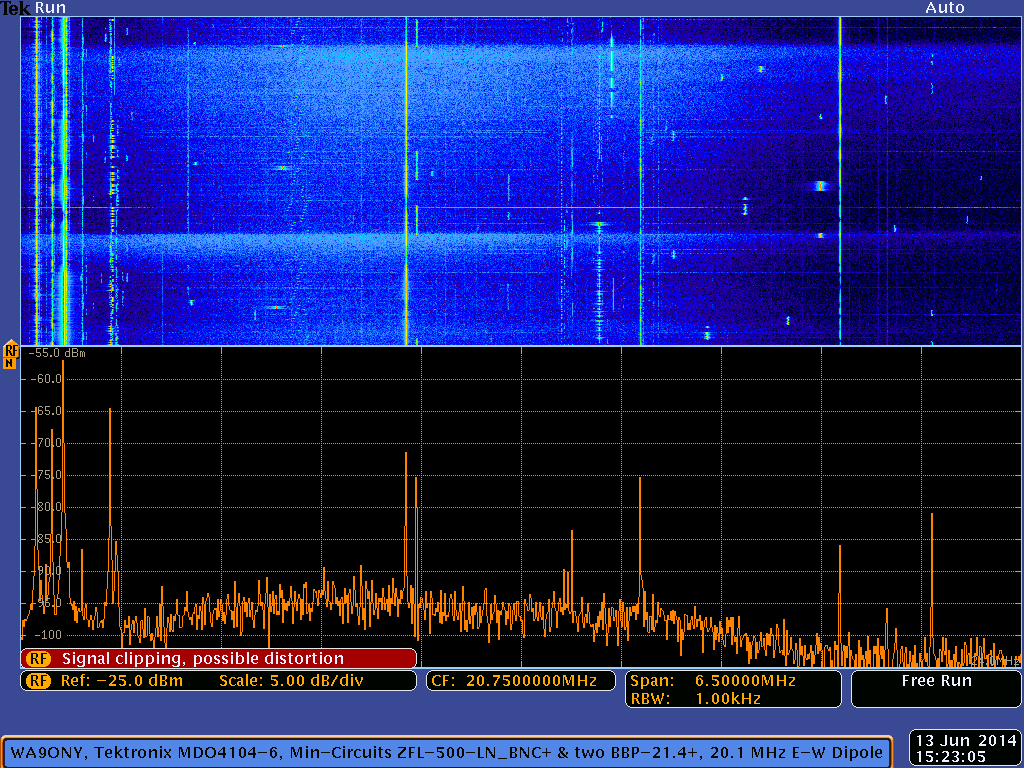
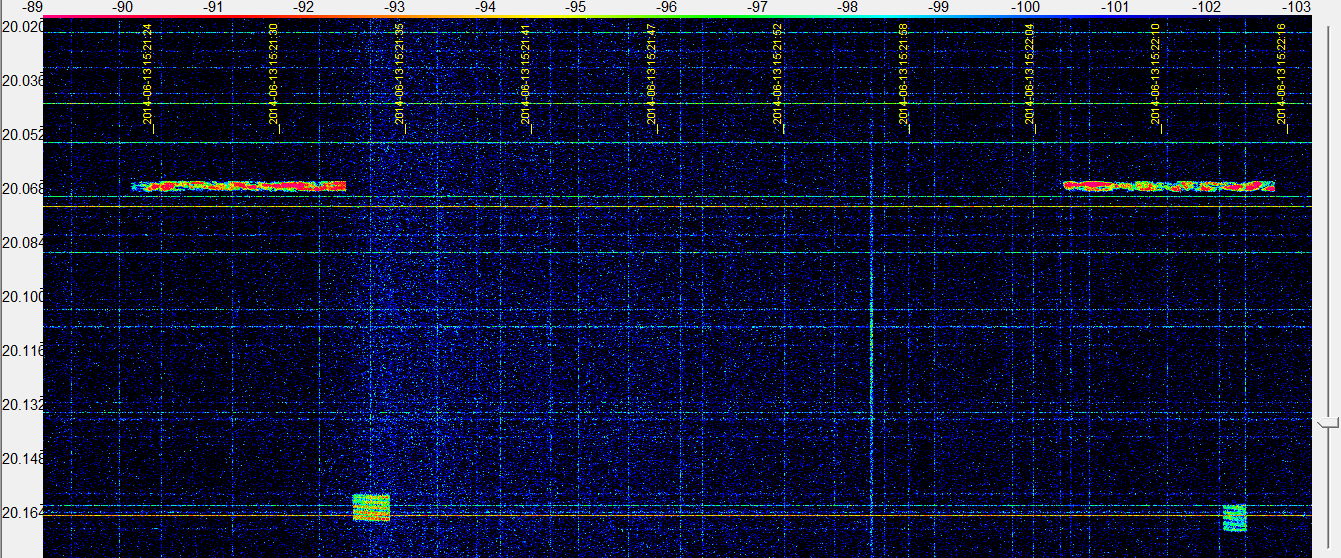
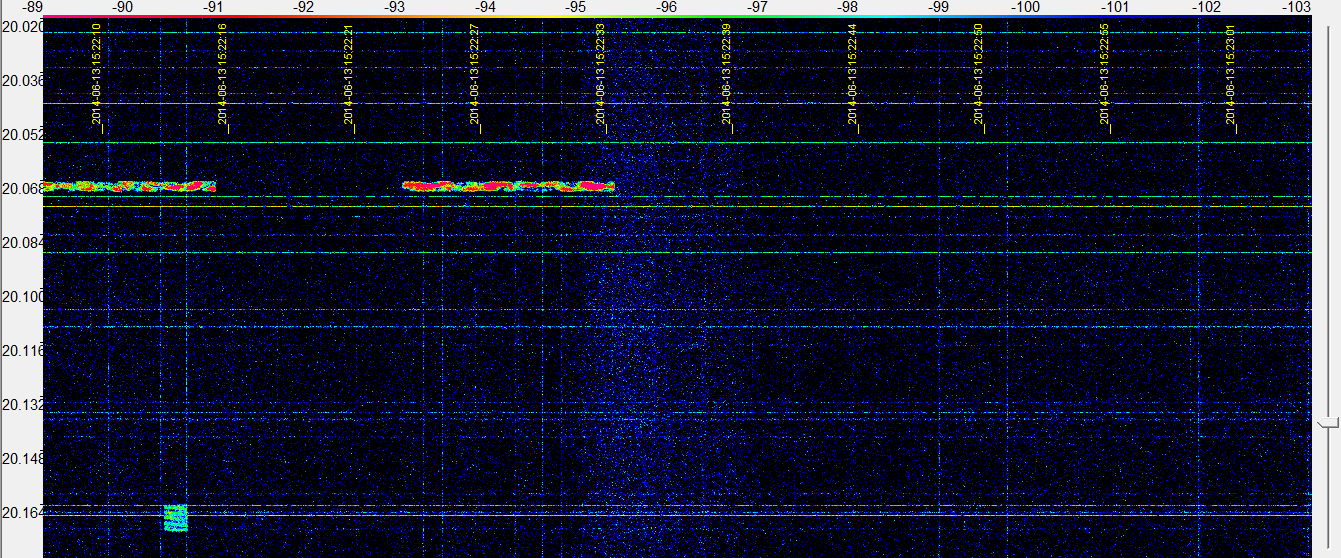
- The below Tektronix MDO4104-6 spectrum analyzer display shows the Sun radio emissions from 17.5 MHz to 24.0 MHz.
- The Sun radio emission is the two broad fuzzy white blueish color in the top blue spectrogram window.
- Compare the spectrogram with the Icom IC-R75 strip chart.
- Radio emission has a rapid onset and slower decay, the two bursts looks like a shark fins.
- Radio stations
- The first set of strong vertical signals from the left edge are the 17.5 MHz to 17.9 MHz broadcasting stations.
- The second set of strong signals from the left edge are the
17 meter (18.068 MHz to 18.168 MHz) amateur radio band.
- Radio station WWV at 20.0 MHz
is the white vertical line in the spectrogram just over one division left of center.
- WWV distance is 1,511 km with a bearing of 105.3 degrees.
- The strong set of signals just right of the center frequency is the
15 meter
(21.0 MHz to 21.45 MHz) amateur radio band.
- The short thin horizontal lines in the spectrogram are weak lighting or weak RFI bursts.
- The antenna sensitivity peaks on the left side of the spectrogram.
- This results in the background noise being a lighter blue color on the left side of the spectrogram.
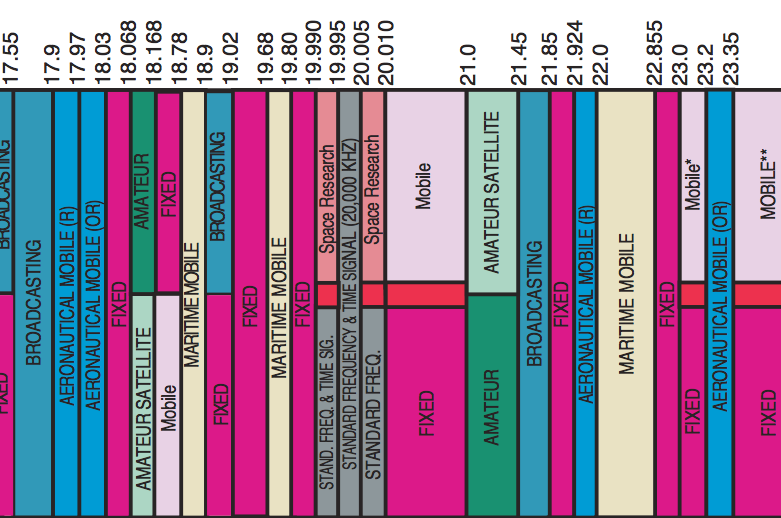
United States Frequency Allocations
Sun Location
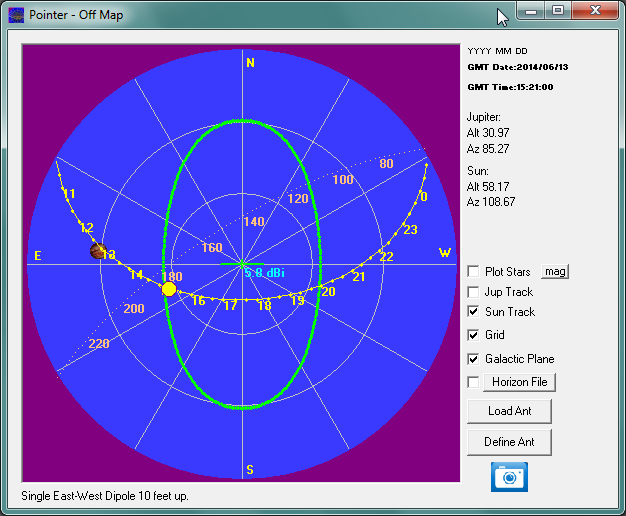
The Sun was 58.17 degrees above the horizon when the solar radio emission occurred.
Tektronix MDO4104-6 Spectrum Analyzer Settings
- Spectrum analyzer is the bottom window
- 17.5 MHz start frequency
- 20.75 MHz center frequency
- 24.0 MHz stop frequency
- 6.5 MHz frequency span
- 6.5 MHz capture bandwidth
- 1 kHz resolution bandwidth
- 650 kHz per horizontal division
- 5 dBm per vertical division
- Spectrogram (waterfall) is the top window
- Spectrogram bottom is the current spectrum trace shown at the bottom of the display.
- Spectrogram top is the oldest spectrum, approximately 1 minute and 45 seconds after the current spectrum trace at the bottom.
- 328 spectrums in the spectrogram.
- 0.32 seconds per spectrum update rate.
- 3.12 spectrums per second update rate.
- Date and time in lower right corner is in UT.
- Python 2.7.6 script taking screen captures every 12 seconds
|
|
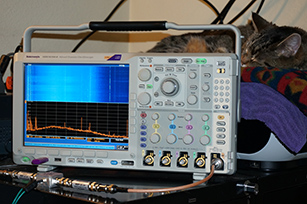
Spectrum Analyzer Equipment
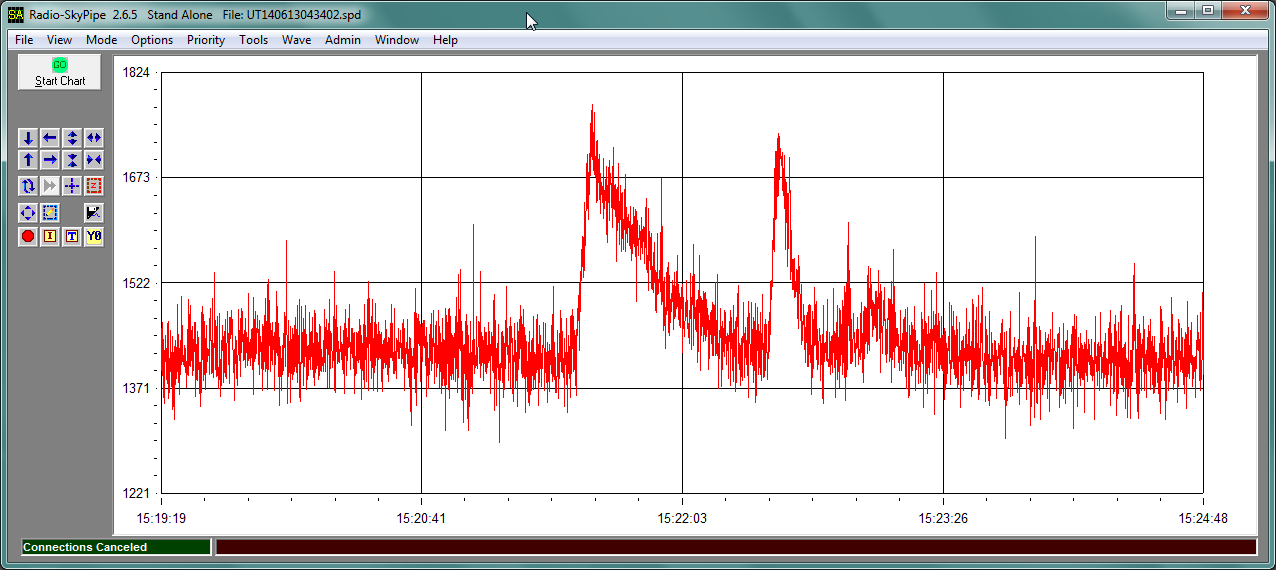
Icom IC-R75 Radio Receiver Strip Chart
- Icom IC-R75 radio receiver with Radio-SkyPipe II strip chart recorder
- Radio emission has a rapid onset and slower decay, the two bursts looks like a shark fins.
Radio Equipment
- Icom
IC-R75
- 20.1MHz
- LSB
- AGC off
- Preamp 2 on
- Behringer
XENYX 302USB 5-Input Mixer with XENYX Mic Preamp and USB/Audio Interface
- The HP laptop does not have a line input, only mic input.
- XENYX 302USB takes the IC-R75 back recorder jack [REC] signal and digitizing it.
- The XENYX 302USB has its own Line gain control.
- The XENYX 302USB has its own headphone gain control.
- MFJ Enterprises
MFJ-1040C Preselector
- Radiowavz
15-DP11 15M dipole antenna with 1:1 Balum
Software
SDR-IQ Receiver Video
RFSpace
SDR-IQ Receiver
RTL-SDR Receiver Video
RTL-SDR Receiver
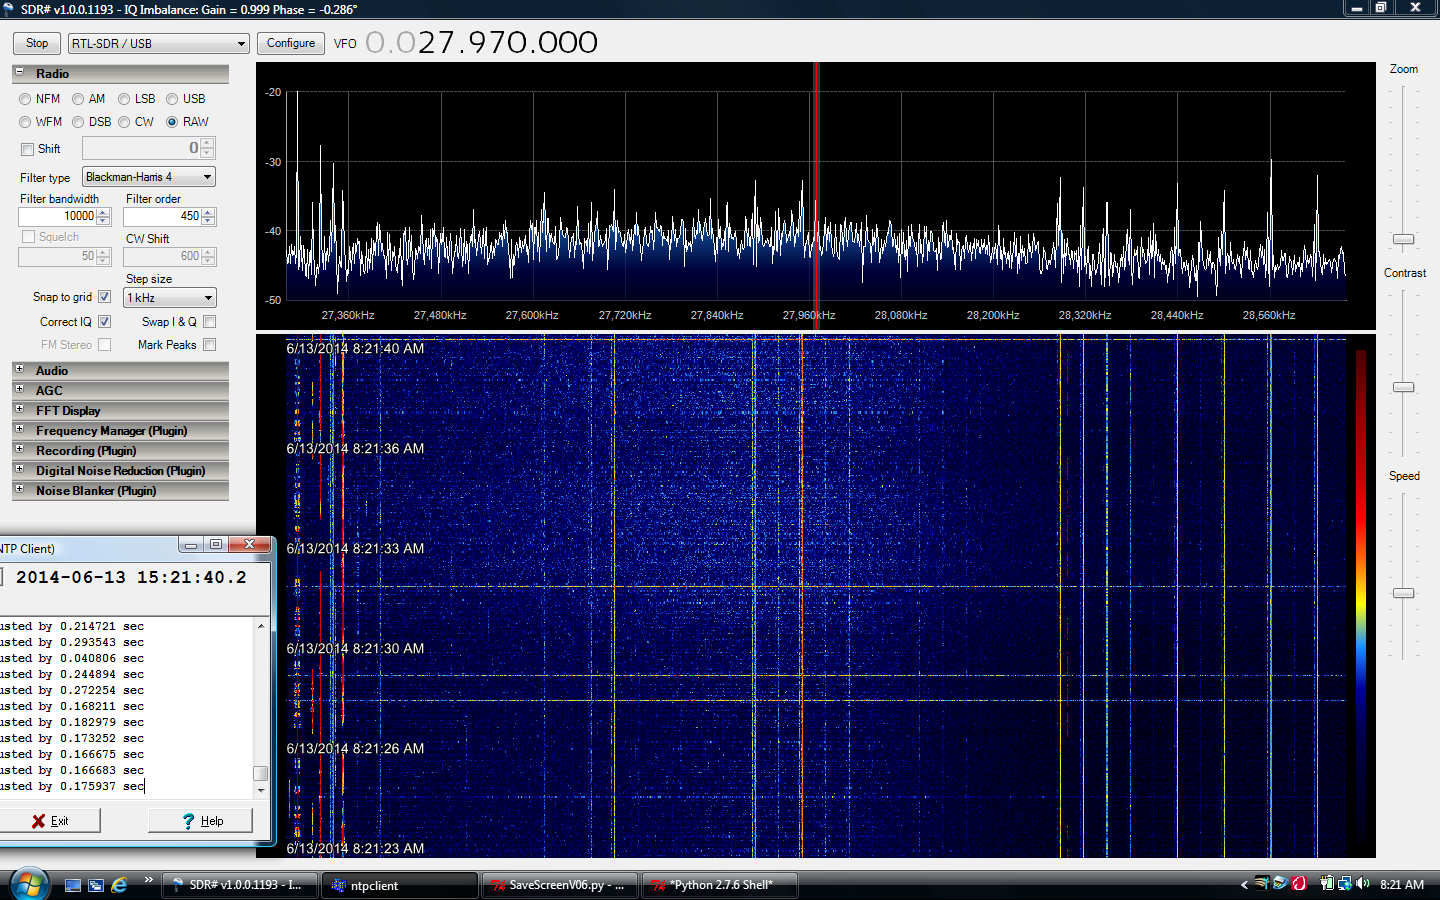
- Below is SDR# spectrum analyzer display showing the Sun radio emissions from approximately 26.240 MHz to 28.680 MHz.
- The Sun radio emission is the broad white noise in the center of the spectrogram window.
- Spectrogram top is the current spectrum trace shown in the top window.
- Spectrogram bottom is the oldest spectrum, approximately 17 seconds after the current spectrum trace at the top.
- 3 to 4 seconds between spectrogram vertical time stamps
- The signals on the left side are the
Citizens band radio (CB radio) (26.965 MHz to 27.405 MHz).
- The signals on the right are the
10 meter
(28.0 MHz to 29.7 MHz) amateur radio band.
United States Frequency Allocations
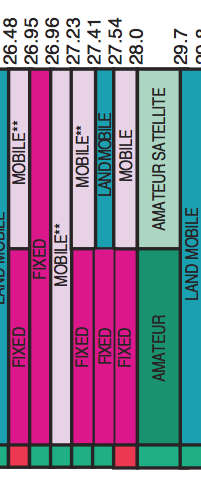
The Radio Spectrum, October 2003
U.S. DEPARTMENT OF COMMERCE
National Telecommunications and Information Administration
|
|
Hardware Equipment
- Radio: NooElec NESDR Mini SDR & DVB-T USB Stick (R820T) based on the Realtek RTL2832U and the Raphael Micro R820T
- A preselector is used to remove the strong stations from overloading the SDR.
- Antenna: Scanner Ant-Base 30-1300 Mhz by Antennacraft, includes 50 feet of RG-6
- Laptop: HP G70 NOtebook PC, Pentium Dual Core CPU, T4200 @ 2.00 GHz, 3 GB RAM, 32-bit
- Data logging to Toshiba 2TB USB hard drive
Software
- SDR# V1.0.0.1193
- Less than 26.951 MHz start frequency
- 28 MHz center frequency
- More than 29.051 MHz stop frequency
- 2.4 MHz frequency span
- 2.4 MHz capture bandwidth
- ACG off
- RF Gain 33.8 dB
- Blackman-Harris 4 FFT window, resolution 32,768
- Python 2.7.6 and
Python Imaging Library (PIL V1.1.7) script taking screen captures every 5 seconds
- Ridiculously Simple NTP Client by Wolfgang "Wolf" DL4YHF for time keeping
- Microsoft Windows Vista Home Premium, Service Pack 2
Observing Information
- OBS-Time: June 13, 2014, 1521 UT
- OBS-Location: Camas, WA USA, 16.6 miles East-North-East from the center of Portland, OR, USA
Radio JOVE Data Archive Calendar
Verifying Solar Burst
NOAA/ National Weather Service
National Centers for Environmental Prediction
Space Weather Prediction Center
Solar Event Reports (Edited Events)
gt:Product: 20140613events.txt
:Created: 2014 Jun 14 1802 UT
:Date: 2014 06 13
# Prepared by the U.S. Dept. of Commerce, NOAA, Space Weather Prediction Center
# Please send comments and suggestions to SWPC.Webmaster@noaa.gov
#
# Missing data: ////
# Updated every 30 minutes.
#                            Edited Events for 2014 Jun 13
#
#Event    Begin    Max       End  Obs  Q  Type  Loc/Frq   Particulars       Reg#
#-------------------------------------------------------------------------------
3940       1521   1524      1527  G15  5   XRA  1-8A      C2.4    5.2E-04   2087
3940 +     1521   1522      1523  SAG  G   RBR  245       290               2087
3940 +     1521   ////      1523  SAG  C   RSP  025-180   III/2             2087
3940 +     1522   1522      1525  HOL  3   FLA  S19E38    SF                2087

Obs   - The reporting observatory.
        CUL - Culgoora, Australia
        HOL - Holloman AFB, NM, USA    LEA - Learmonth, Australia
        PAL - Palahua, HI, USA         RAM - Ramey AFB, PR, USA
        SAG - Sagamore Hill, MA, USA   SVI - San Vito, Italy

Q     - Quality
        For radio bursts at fixed and sweep frequencies, and for storms, this
        shows the quality of the data
                       C = Corrected report
                       G = Good
                       U = Uncertain
        For optical flares, this shows the quality of observing conditions,
        from 1 to 5, where:  1 = very poor and 5 = excellent

        X-ray events and SXI flare have a quality of 5 (meaning excellent).


Type  - Type of report, see http://www.swpc.noaa.gov/info/glossary.html
          BSL = Bright surge on the limb
          DSF = Filament disappearance
          EPL = Eruptive prominence on the limb
          FIL = Filament
          FLA = Optical flare observed in H-alpha
          FOR = Forbush decrease (cosmic ray decrease))
          GLE = Ground-level event (cosmic ray increase)
          LPS = Loop prominence system
          PCA = Polar cap absorption
          RBR = Fixed-frequency radio burst
          RNS = Radio Noise Storm
          RSP = Sweep-frequency radio burst
          SPY = Spray
          XFL = SXI X-ray flare from GOES Solar X-ray Imager (SXI)
          XRA = X-ray event from SWPC's Primary or Secondary GOES spacecraft

   RSP:
    Type/Intensity
	Type  II: Slow drift burst
	Type III: Fast drift burst
	Type  IV: Broadband smooth continuum burst
	Type   V: Brief continuum burst, generally associated with Type III bursts
	Type  VI: Series of Type III bursts over a period of 10 minutes or more,
	           with no period longer than 30 minutes without activity
	Type VII: Series of Type III and Type V bursts over a period of 10 minutes
	           or more, with no period longer than 30 minutes without activity
	Type CTM: Broadband, long-lived, dekametric continuum

	Intensity is a relative scale 1=Minor, 2=Significant, 3=Major
|
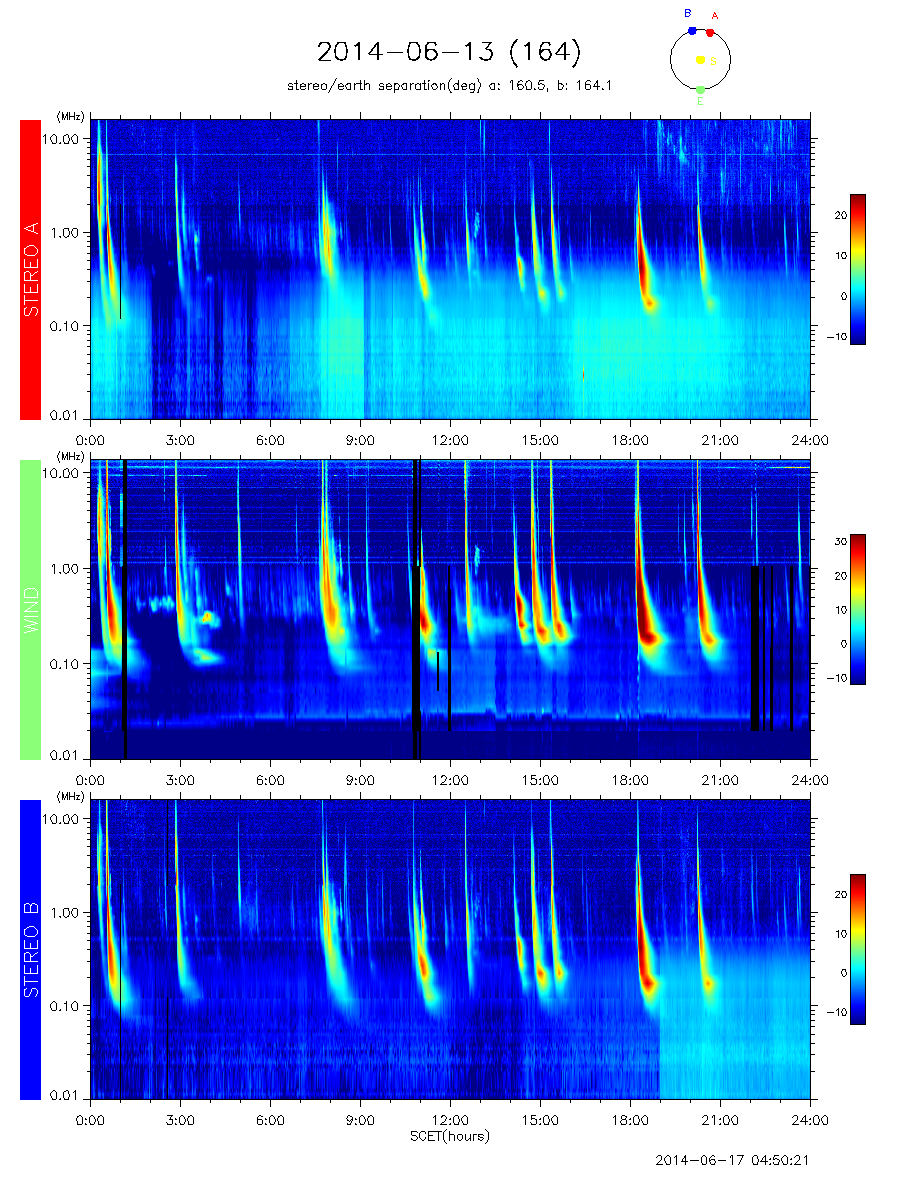
NASA STEREO / WAVES
NASA WIND-WAVES: The Radio and Plasma Wave Investigation on the WIND Spacecraft
NASA STEREO (Solar TErrestrial RElations Observatory)
NASA STEREO / WAVES data

|