|
The Sun type III radio emission burst was observed with two instruments.
- Tektronix MDO4104-6 spectrum analyzer being controlled by HP laptop with Python script to log screen captures.
- Icom
IC-R75 radio receiver with Radio-SkyPipe strip chart recorder.

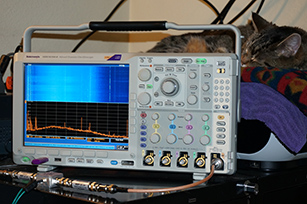
Tektronix MDO4104-6 spectrum analyzer
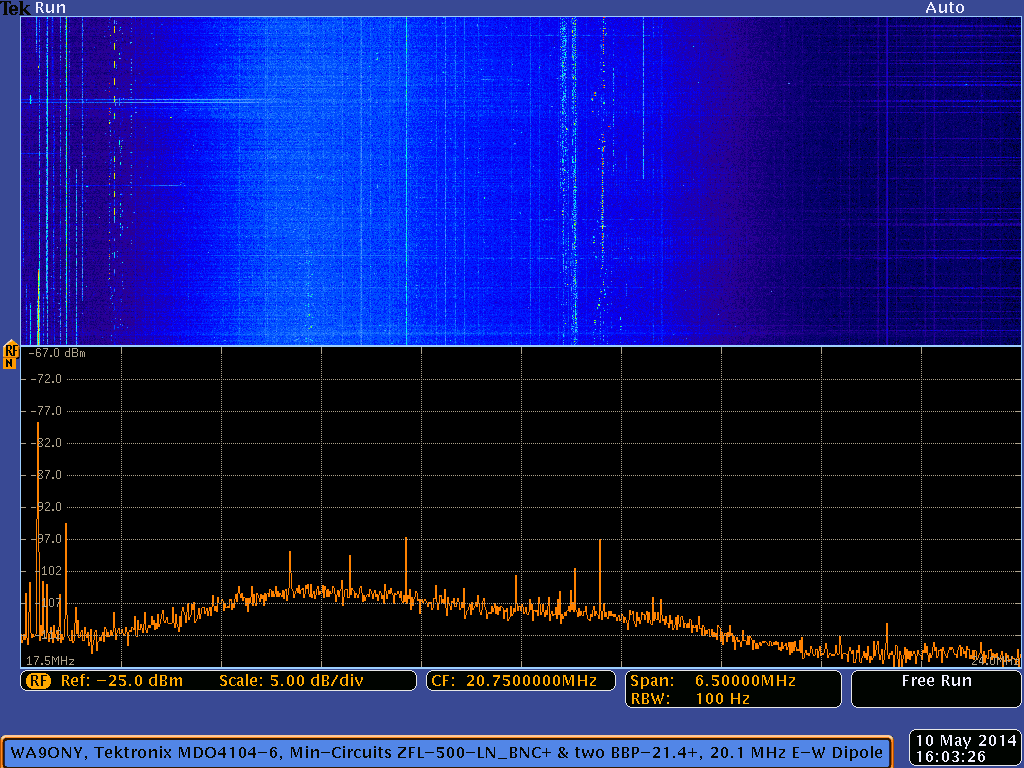
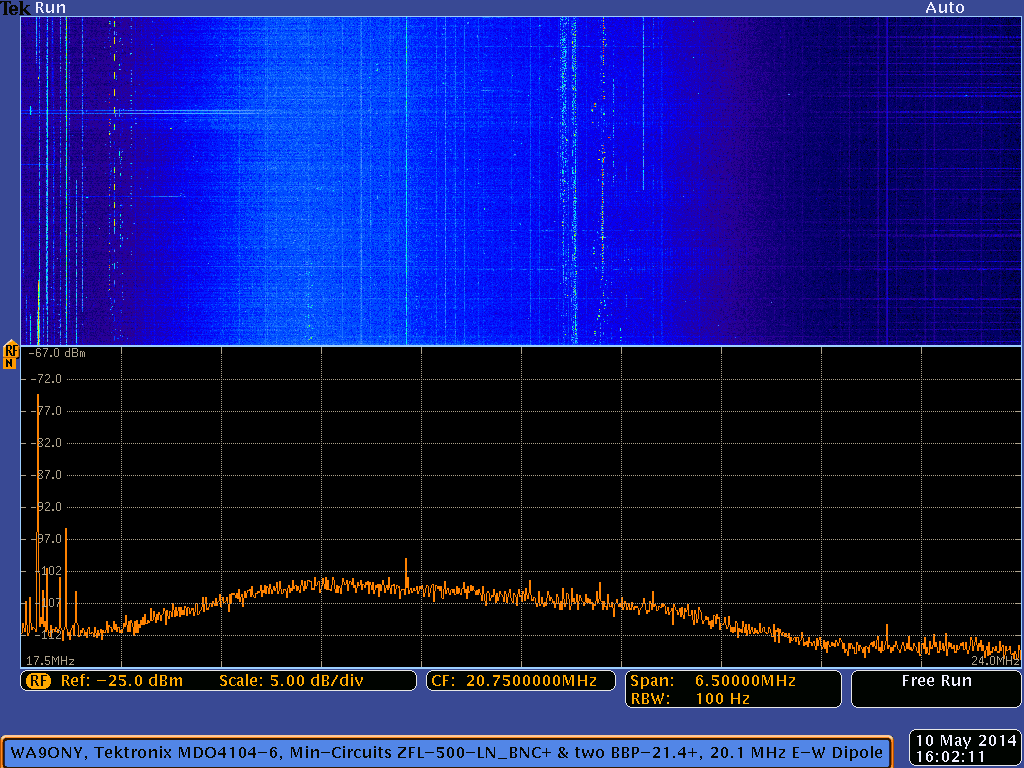
- The below Tektronix MDO4104-6 spectrum analyzer display shows the Sun radio emissions.
- The Sun radio emission is the faint fuzzy white blueish horizontal lines just above the bottom of the blue spectrogram window.
- The first set of strong vertical signals from the left edge are the 17.5 MHz to 17.9 MHz broadcasting stations.
- The strongest broadcast radio stations are solid vertical lines in the spectrogram.
- The second set of strong signals from the left edge are the
17 meter (18.068 MHz to 18.168 MHz) amateur radio band.
- Amateur radio signals are short transmissions and look like dots or vertical dashes in the spectrogram.
- Radio station WWV at 20.0 MHz
is the blue vertical line (with a few gaps in the line) in the spectrogram just over one division left of center.
- WWV distance is 1,511 km with a bearing of 105.3 degrees.
- The strong set of signals just right of the center frequency is the
15 meter
(21.0 MHz to 21.45 MHz) amateur radio band.
- The other faint horizontal lines in the spectrogram are lighting or RFI bursts.
- The antenna sensitivity peaks on the left side of the spectrogram.
- This results in the background noise being a lighter blue color and it is the vertical broad white-blue band on the left side of the spectrogram.
Tektronix MDO4104-6 Spectrum Analyzer Video
- 20140510_1600Sun file video
- Manually scroll through the video frame by frame to see each spectrum trace.
- The ~2 dB rise in the noise floor caused by the solar radio emission is difficult to see in the two frames (16:02:04 and 16:02:11) that it occured.
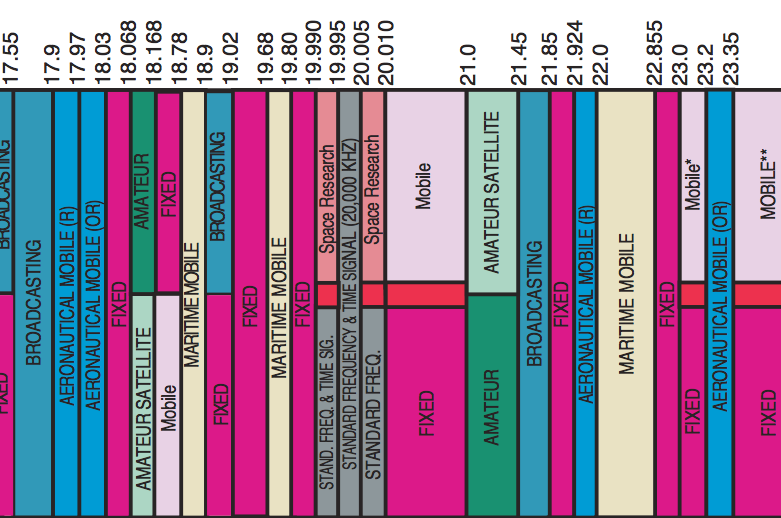
United States Frequency Allocations
Strongest Solar Radio Burst Captured with the Spectrum Analyzer
- The spectrogram does not show the burst very clearly because it is on the bottom next to the window divider to the bottom spectrum trace window.
Spectrum Analyzer Summary
The above spectrum trace shows approximately a ~2 dB rise in nose level for the strongest Sun radio emission signal acquired at 16:02:11 UT. The Sun was 61.32 degrees above the horizon when the solar radio emission occurred.
Tektronix MDO4104-6 spectrum analyzer.
- 17.5 MHz start frequency
- 20.75 MHz center frequency
- 24.0 MHz stop frequency
- 6.5 MHz frequency span
- 6.5 MHz capture bandwidth
- 100 Hz resolution bandwidth
- 650 kHz per horizontal division
- 5 dBm per vertical division
- ~7 seconds spectrum update rate
- Spectrogram bottom is the current spectrum trace shown at the bottom of the display.
- Spectrogram top is the oldest spectrum, approximately 30 minutes after the current spectrum trace at the bottom.
- Date and time in lower right corner is in UT.
|
|
Spectrum Analyzer Equipment
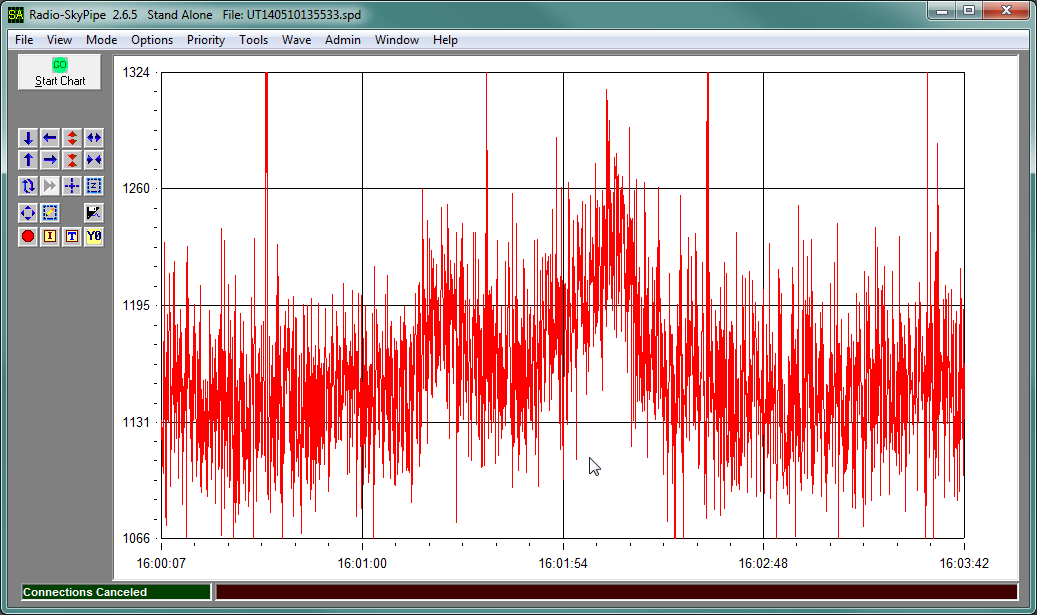
Icom IC-R75 Radio Receiver Strip Chart
- Icom IC-R75 radio receiver with Radio-SkyPipe II strip chart recorder
Radio Equipment
- Icom
IC-R75
- 20.1MHz
- LSB
- AGC off
- Preamp 2 on
- Behringer
XENYX 302USB 5-Input Mixer with XENYX Mic Preamp and USB/Audio Interface
- The HP laptop does not have a line input, only mic input.
- XENYX 302USB works great taking the IC-R75 back recorder jack [REC] signal and digitizing it.
- The XENYX 302USB has its own Line gain control.
- The XENYX 302USB has its own headphone gain control.
- MFJ Enterprises
MFJ-1040C Preselector
- Radiowavz
15-DP11 15M dipole antenna with 1:1 Balum
Software
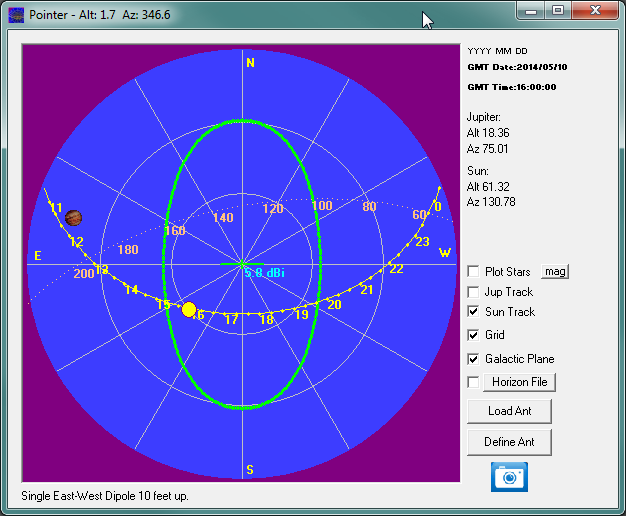
Observing Information
- OBS-Time: May 10, 2014, 1600 UT
- OBS-Location: Camas, WA USA, 16.6 miles East-North-East from the center of Portland, OR, USA
Radio JOVE Data Archive Calendar
Verifying Solar Burst
NOAA/ National Weather Service
National Centers for Environmental Prediction
Space Weather Prediction Center
Solar Event Reports (Edited Events)
- Solar burst began at 1600 UT and ended at 1605 UT
- Reporting observatory SAG: Sagamore Hill, MA, USA
- Event RSP: Sweep-frequency radio burst
- Frequency: 25 MHz to 107 MHz
- Particulars: type III burst of major intensity 2
- Type III burst: Fast drift burst.
- 2 is significant intensity rating
:Product: 20140510events.txt
:Created: 2014 May 11 1202 UT
:Date: 2014 05 10
# Prepared by the U.S. Dept. of Commerce, NOAA, Space Weather Prediction Center
# Please send comments and suggestions to SWPC.Webmaster@noaa.gov
#
# Missing data: ////
# Updated every 30 minutes.
#                            Edited Events for 2014 May 10
#
#Event    Begin    Max       End  Obs  Q  Type  Loc/Frq   Particulars       Reg#
#-------------------------------------------------------------------------------
7480 +     1600   ////      1605  SAG  C   RSP  025-107   III/2
|
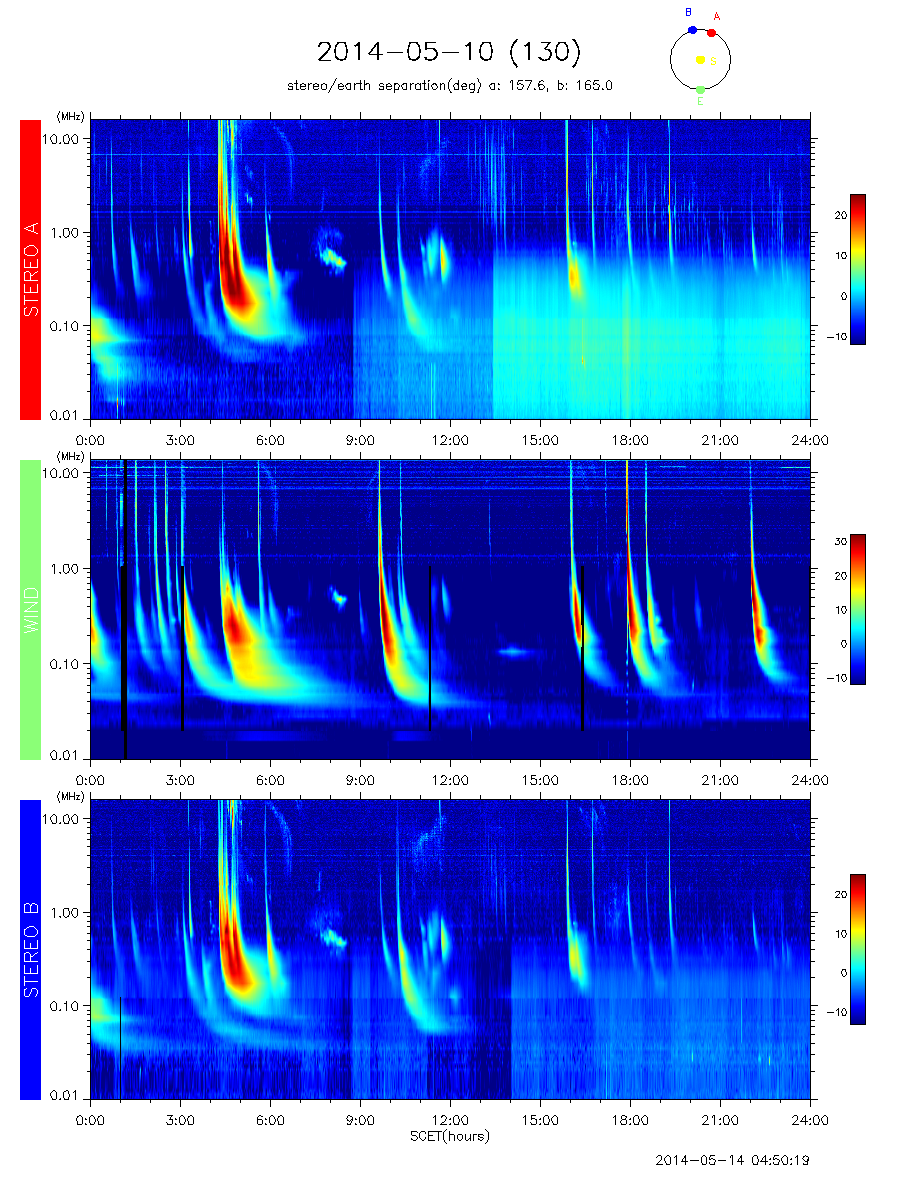
NASA STEREO / WAVES
NASA WIND-WAVES: The Radio and Plasma Wave Investigation on the WIND Spacecraft
NASA STEREO (Solar TErrestrial RElations Observatory)
NASA STEREO / WAVES data

|