|
This GNU Radio project was to learn how to use
GNU Radio Companion
to create signal flow graph (gr file)
and then create source code (py file) to control the the
Realtek RTL2832U SDR.
YouTube Video
SDR Design Goals
- Learn how to use GNU Radio Companion.
- Simple SDR to control the Realtek RTL2832U SDR.
- Use the WX GUI Spectrum Plot.
- Use the WX GUI Spectrum Waterfall Plot.
- Use the WX GUI Constellation Plot.
- Use the WX GUI Scope Plot.
- WX GUI notebook that supports multiple tabs.
- WX GUI slider to set the center frequency.
- The center frequency slider moves in increments of 200 kHz on across the
FM broadcast band
- USA start frequency is 87.9 MHz.
- USA end frequency is 107.9 MHz.
- WX GUI slider to set the RF gain.
- The RF gain slider moves in increments of 1 from 0 to 45.
- This is based on the results of rtl_test
- WX GUI text to set the sample rate.
- WX GUI static text to provide a label.

Understanding DSP Techniques
- There are four different ways to measure a signal.
- Frequency Spectrum Plot (Also, called a
spectrum analyzer instrument)
- Measure signal amplitude versus frequency.
- This called frequency domain analysis.
- The signal line is called a spectrum trace.
- Vertical axis is amplitude.
- Amplitude is in dB which is logarithmic.
- A logarithmic scale shows more dynamic range than using a linear scale.
- The horizontal axis is frequency.
- Usually the center frequency is the signal of interest.
- The start frequency (lowest frequency) is the left edge.
- The end frequency (highest frequency) is the right edge.
- The span is the end frequency minus the start frequency.
- The span is dependent upon the sample rate setting.
- Spectrum Waterfall Plot (Also called the
spectrogram)
- Measure signal amplitude versus frequency and versus time.
- This called frequency domain analysis.
- The horizontal axis is frequency, the same as the spectrum plot horizontal axis.
- The vertical axis is time.
- The current time trace is on the bottom.
- The oldest time trace is on the bottom.
- The color of the trace is the amplitude of the signal.
- Bright colors represent strong signal amplitude.
- Dark colors represent weak signal amplitude.
- GNU radio has several different color mappings: RGB1, RGB2, RGB3 and gray.
- Constellation Plot (IQ:
Inphase and Quadrature signals)
- the inphase versus quadrature signal is plotted.
- The horizontal axis is the inphase signal.
- Zero amplitude is in the center.
- Negative amplitude is to the left of center.
- Positive amplitude is to the left of center.
- The vertical axis is the quadrature signal.
- Zero amplitude is in the center.
- Negative amplitude is to the left of center.
- Positive amplitude is to the left of center.
- One sample is one dot on the constellation plot.
- Two samples are two dots on the constellation plot.
- Three samples are three dots on the constellation plot.
- Hundred samples are hundred dots on the constellation plot.
- Scope Plot (Also called an
oscilloscope instrument)
- Measure signal amplitude versus time.
- This called time domain analysis.
- The signal line is called a waveform.
- The horizontal axis is time measured from the start of the waveform.
- GNU Radio time axis is longer than the display.
- You use T Offset (time offset) to select the different parts of the waveform.
- The vertical axis is signal amplitude usually measured in a linear scale.
- In the center of the vertical axis is 0 amplitude.
- Above center is positive amplitude.
- Below center is negative amplitude.
Download: FMstationsRTL.zip (4 KB)
- GNU Radio Companion file: FMstationsRTL.grc 18 KB
- Python file: FMstationsRTL.py 9 KB
GNU Radio Companion Signal Flow Graph
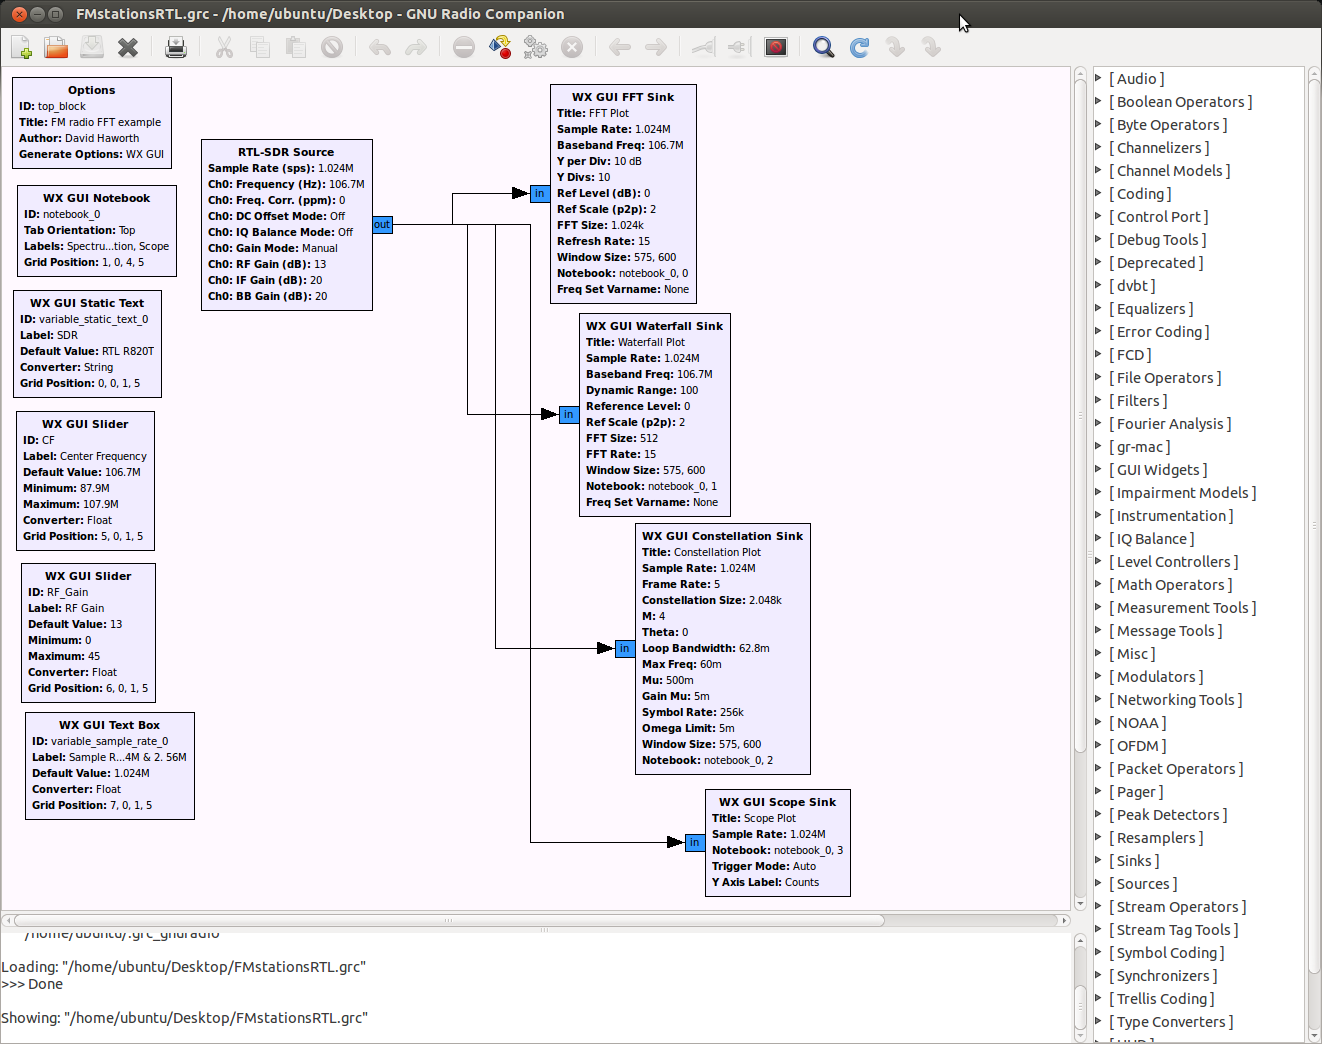
106.7 MHz Center Frequency
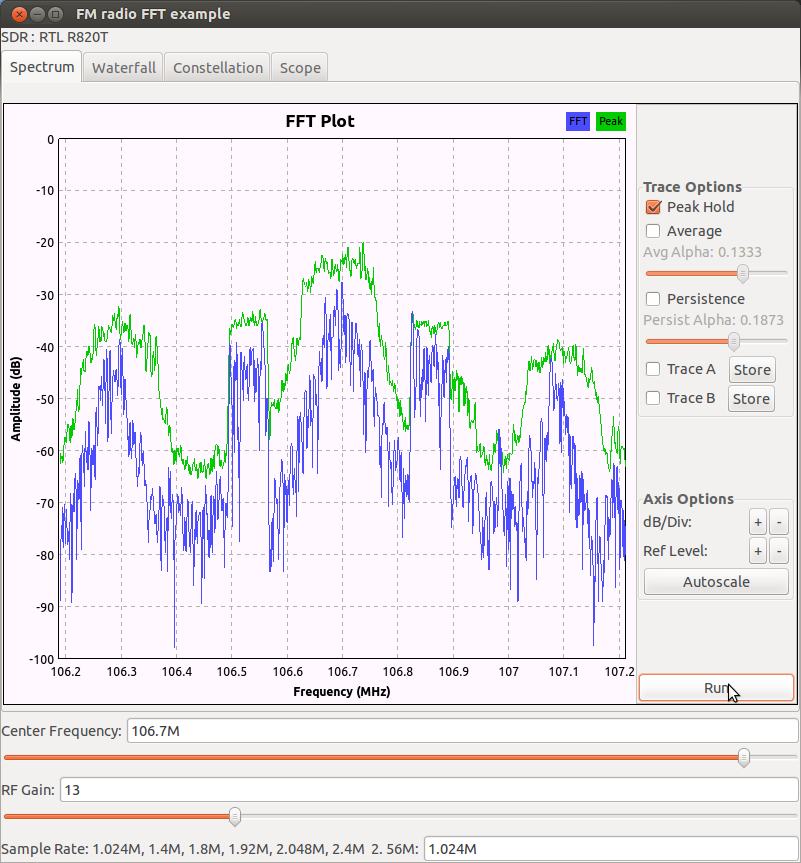
GNU Radio FMstationsRTL.py Program Spectrum (Frequency Domain) Plot
- The center frequency is tuned to 106.7 MHz.
- The RF gain is set to 13 for best signal to noise ratio across the FM band.
- The sample rate is set to 1.024 MS/s which provides 2.024 MHz span.
- The peak hold is turned on and it is the green spectrum trace.
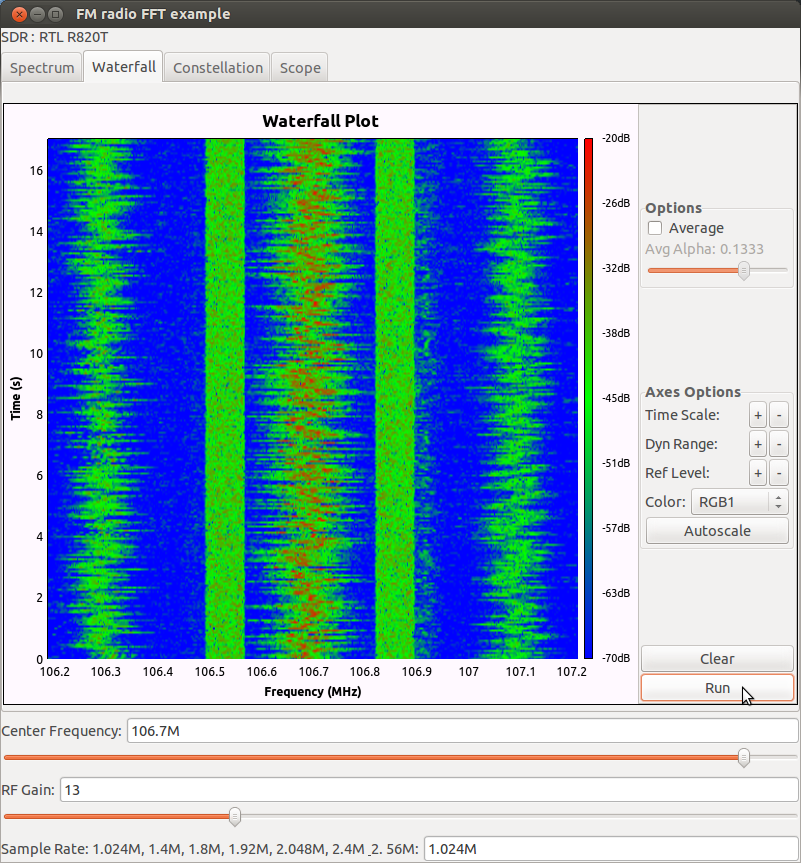
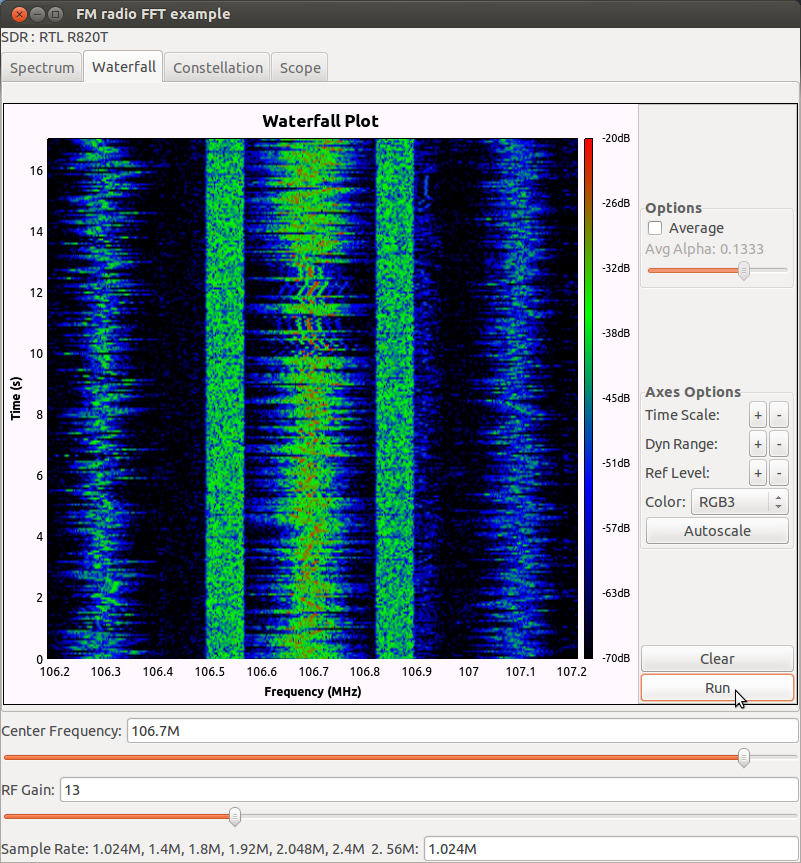
GNU Radio FMstationsRTL.py Program Spectrum Waterfall (Spectrogram) Plot
- The Color is RGB1 with Autoscale.
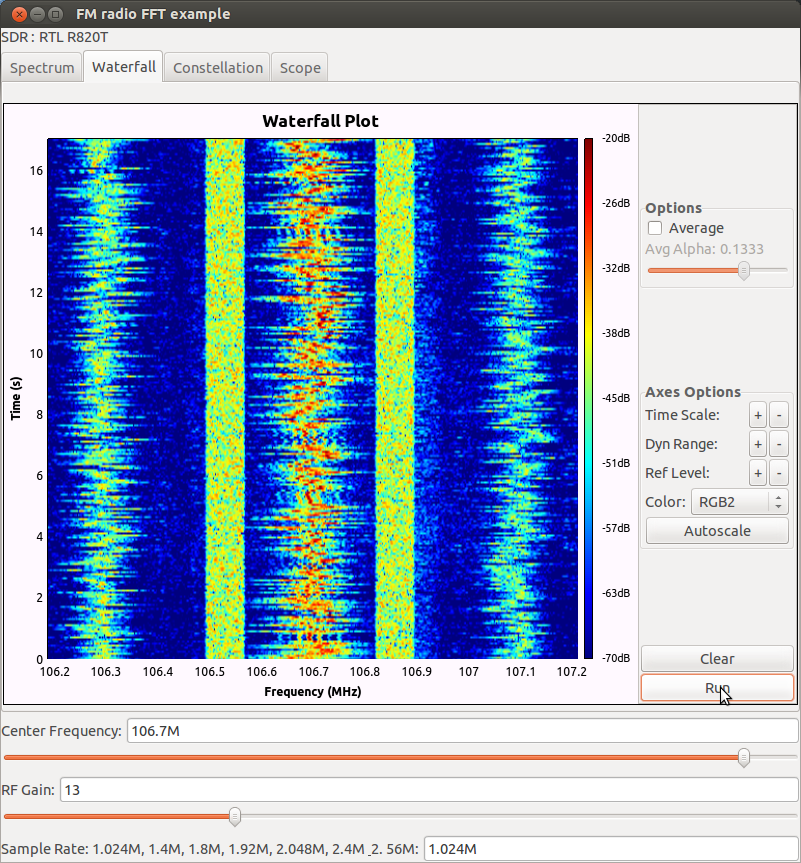
GNU Radio FMstationsRTL.py Program Spectrum Waterfall (Spectrogram) Plot
- The Color is RGB2 with Autoscale.
GNU Radio FMstationsRTL.py Program Spectrum Waterfall (Spectrogram) Plot
- The Color is RGB3 with Autoscale.
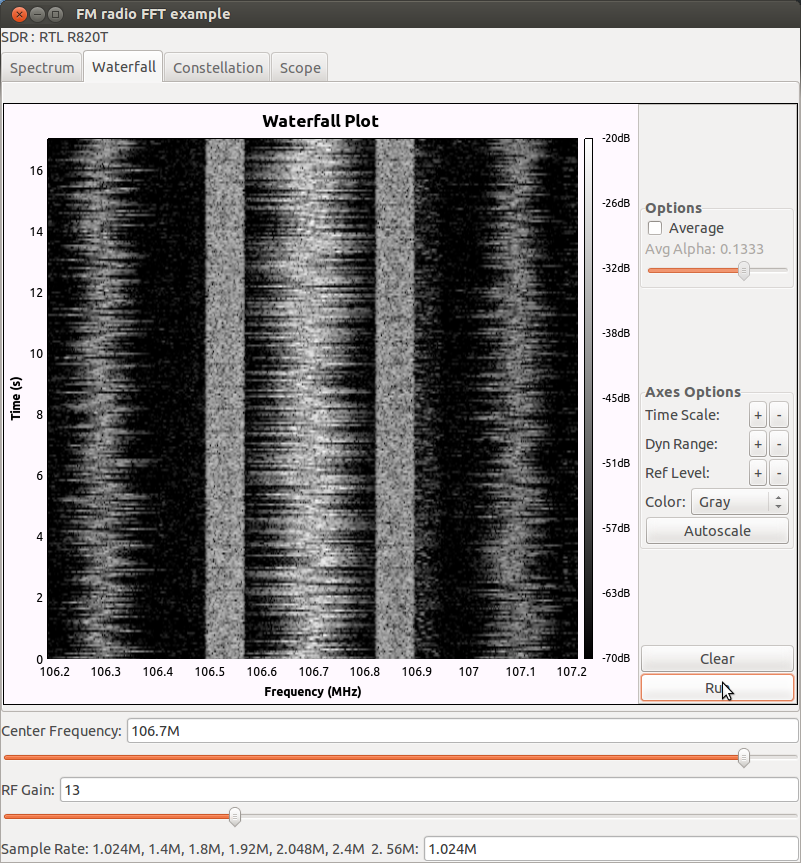
GNU Radio FMstationsRTL.py Program Spectrum Waterfall (Spectrogram) Plot
- The Color is Gray with Autoscale.
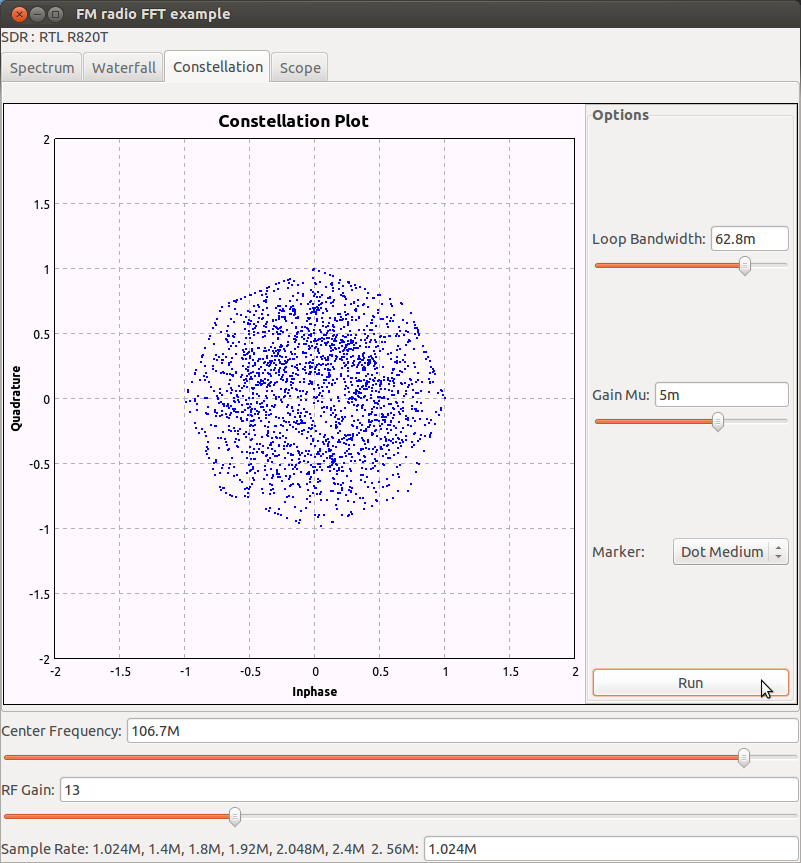
GNU Radio FMstationsRTL.py Program Constellation (IQ: Inphase versus Quadrature) Plot
- The default settings are used.
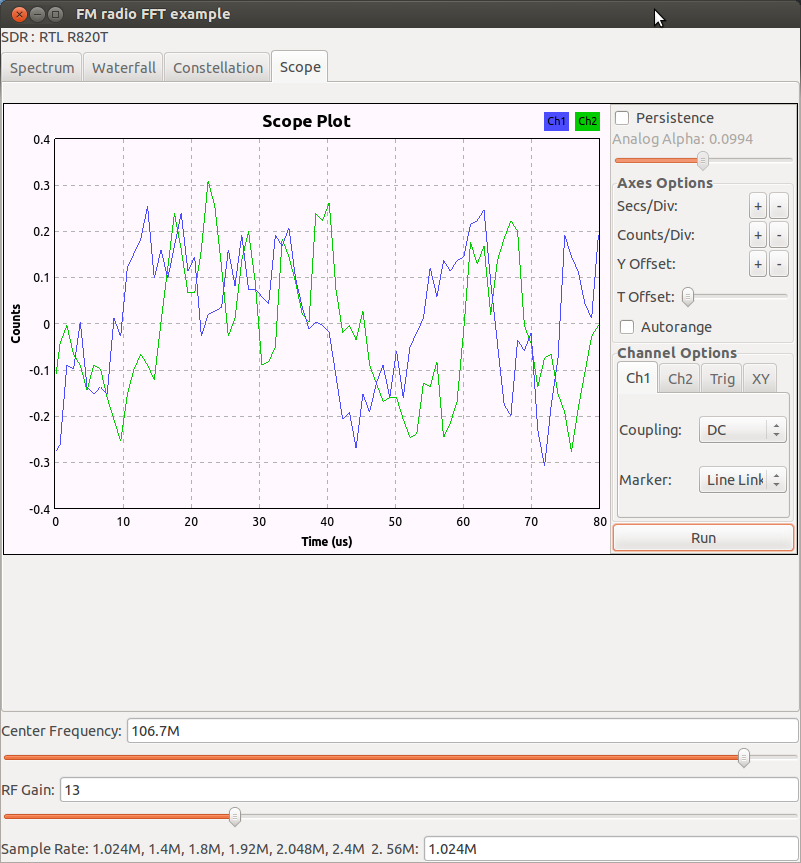
GNU Radio FMstationsRTL.py Program Scope (Time Domain) Plot
- The Counts/Div was increased to 0.1/Divison and the T (Time) Offset was sent to zero.
95.5 MHz Center Frequency
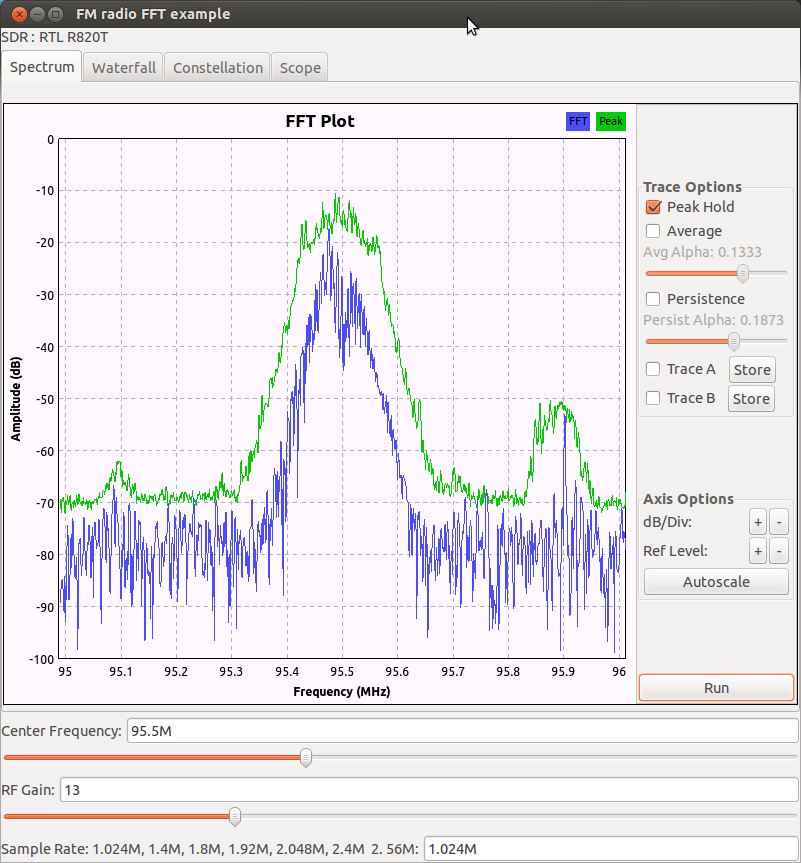
GNU Radio FMstationsRTL.py Program Spectrum (Frequency Domain) Plot
- The center frequency is tuned to 95.5 MHz where is all most no other FM stations in the spectrum analyzer span.
- The RF gain is set to 13 for best signal to noise ratio across the FM band.
- The sample rate is set to 1.024 MS/s which provides 2.024 MHz span.
- The peak hold is turned on and it is the green spectrum trace.
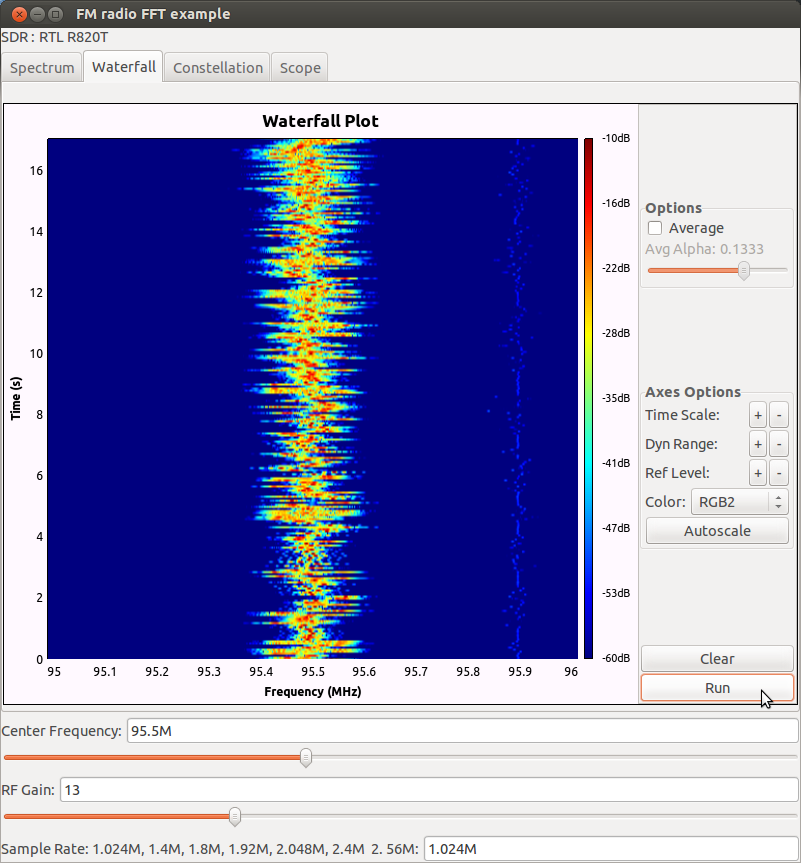
GNU Radio FMstationsRTL.py Program Spectrum Waterfall (Spectrogram) Plot
- The Color is RGB2 with Autoscale.
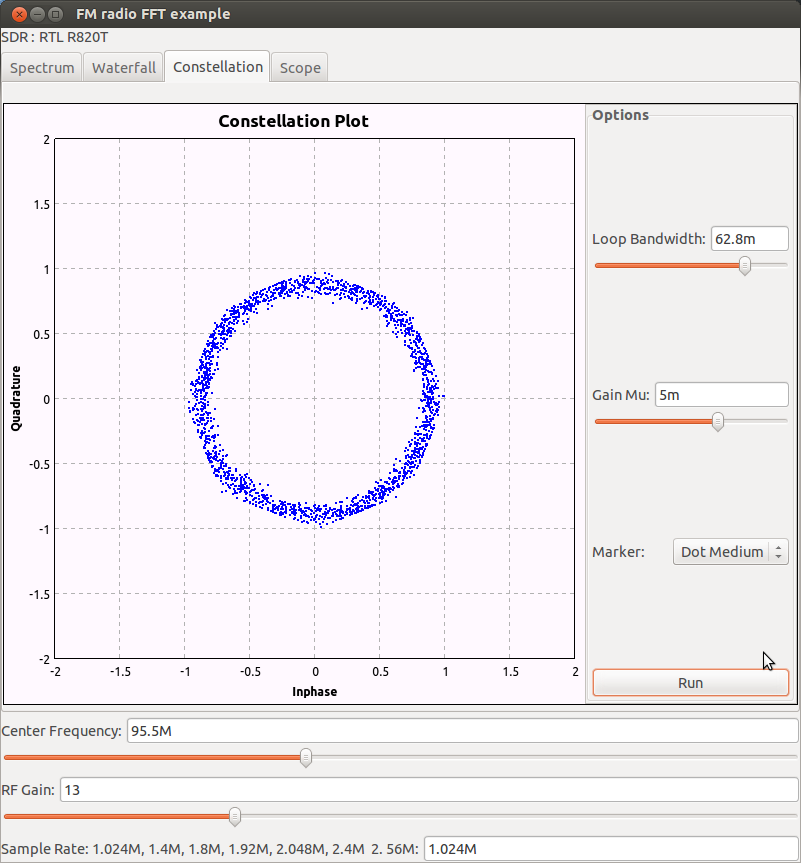
GNU Radio FMstationsRTL.py Program Constellation (IQ: Inphase versus Quadrature) Plot
- The default settings are used.
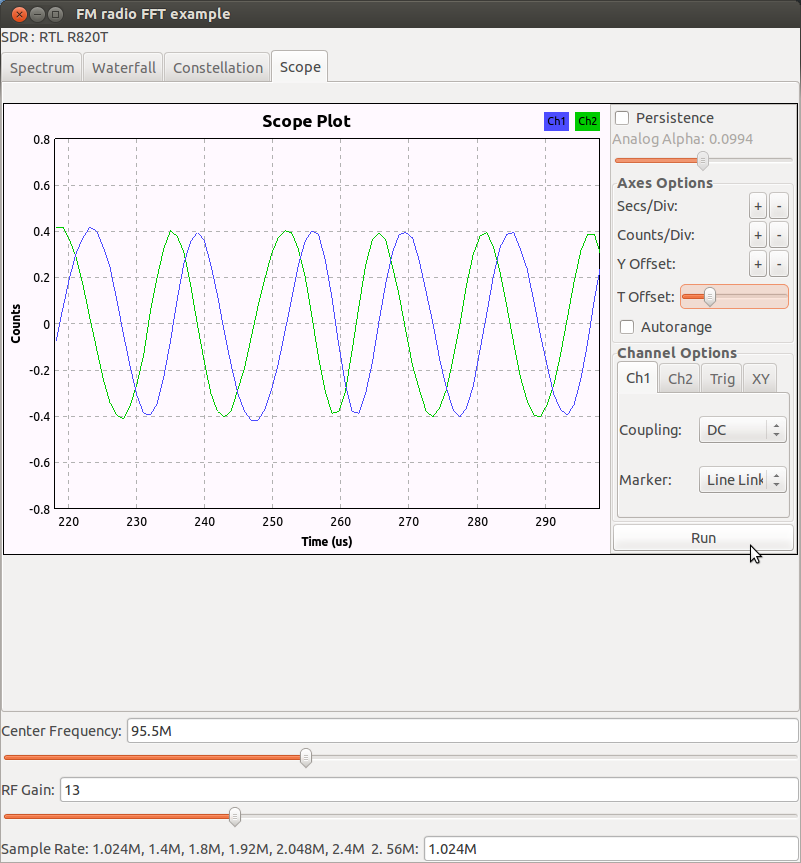
GNU Radio FMstationsRTL.py Program Scope (Time Domain) Plot
- The Counts/Div was increased to 0.1/Divison and the T (Time) Offset was sent to zero.
Software and PC
- GNU Radio Live SDR Environment DVD 2014-0419 snapshot
- Dell Inspiron 17R (i17RM-83901sLV) Window 8.1 notebook running Ubuntu Live DVD.
- 64-bit, Intel Core i7-4500U CPU @ 1.80 GHz x 4 with 8 GB RAM.
Software-Defined Radio (SDR) Hardware
- SDRs based on Realtek RTL2832U and Raphael Micro R820T Digital Video Broadcasting Terrestrial (DVB-T)
Receivers using USB
- Features
- 2+ MHz capture bandwidth
- The RTL2832U streams 8-bit I+Q data into the PC using USB.
- Frequency Range (approximate) 25MHz - 1750MHz
- Female MCX Antenna Connector
- Very low cost ~$20
- Low cost SDR to learn about using a SDR with software
- In the USA NooElec is a good source for the SDR receivers & up converter.
- Antenna Scanner Ant-Base 30-1300 Mhz by Antennacraft, includes 50 feet of RG-6
|