![]()
[ Root ]
[ Top ]
This page describes charts for the year 2000 which can be downloaded in Adobe Acrobat format or as a large GIF. These charts show on one side of A4, for each day in the year 2000;
These charts enable you to decide on your chances of seeing a given planet on a given day in 2000. The charts are modelled on those found on pages A6 and A7 of the Astronomical Almanac, and this page forms a minor protest at the refusal of my local reference library to stock the Almanac. These charts provide enough detail for most simple planning exercises, without using any batteries and requiring no mouse clicks. I believe that they give some insight into the motions of the planets in the sky, and how the sky works.
In the Northern hemisphere, the sphere of stars seems to revolve around the Pole Star, in the Northern part of the sky. Stars near Polaris never rise or set, but as you look further to the south, you will find stars which rise in the east and set in the west. Imagine a line on the sky drawn from the South pole, through the point directly overhead, to the North celestial pole. This line is your meridian. The transit time for a star or other celestial object is the time the object crosses your meridian south of the celestial equator. This transit time also corresponds to the time when the object is highest in the sky for Northern observers, and is also known as culmination, or upper culmination in the case of a star which does not rise or set.
Some stars do not stay in the same position on the Celestial Sphere. These wanderers are the planets, and their transit times will change from day to day. A chart of the transit times for the Sun, Mercury, Venus, Mars, Jupiter and Saturn will give you a good idea of the observability of these planets, and which constellation they are in on a given day of the year.
[ Top ]
The charts were produced in Microsoft Excel, and are available here as an Adobe Acrobat file (for which you need a copy of the Adobe Acrobat reader) and as large GIF file. The Adobe versions provide much better print quality, and the whole point of these graphs is to print them onto paper.
To print the GIF file, just
To print the Adobe format version, some browsers use the Adobe Acrobat reader as a plug-in, so following the link will load the reader. In this case, just hit print. With older browsers, you will need to save the Adobe Acrobat file to your computer, and then load it into the reader to print the file.
The Adobe Acrobat file was generated using the freeware GhostScript and an Adobe Acrobat PostScript printer driver. If you have any problems rendering the file, I would like to hear from you.
[ Top ]
The charts use day numbers in 2000, a leap year, so use the table below to find the number of any day.
                 Jan     0        Jul   182
                 Feb    31        Aug   213
                 Mar    60        Sep   244
                 Apr    91        Oct   274
                 May   121        Nov   305
                 Jun   152        Dec   335

To find the day number of any date in 2000, just add the date to the
number of days before the month given above. eg, May 26th 2000 is day
number 121 + 26 = 147
To find the transit time of a given planet or the Sun, you just
The corrections in step 5 and 6 depend only on your location - you can work out the correction and write the figure on the charts.
Reading off the declination is very similar, except there is no need to correct for local time. Once you have the declination, you can easily work out the altitude of the object at transit - if you know your geographical latitude.
In practice, I tend to work to the nearest 10 day period on the days axis, and I tend to regard each major division as a month. This leads to a worst case error of 5 days at the end of the year - not too dramatic for most of the planets (but possibly important for fast moving Mercury).
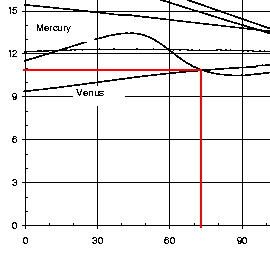
Below, I find the transit of Venus on 13th March 2000 (day 73).

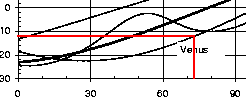
I estimate the declination for Venus on the same day to be -12 degrees:

As I live at a latitude of 52.5 North, I expect to find Venus at
at the time of transit. This is not much use for Venus so near the Sun, but for planets further from the Sun, you can get a good idea of where to find them in the night sky. SkymapPro gives -12 deg 29 arcmin for the declination of Venus, and 25 deg 24 arcmin for its altitude at the time of transit.
You may have noticed that Venus and Mercury are close in the sky around March 13 - 16.
A look at the Transit chart will convince you of the following general principles
[ Root ]