ÿþ<HTML> <HEAD> <TITLE>Vega Low Resolution Spectrum</TITLE> <LINK REL=STYLESHEET TYPE="text/css" HREF="../misc/css1.css" TITLE="CSS1"> </HEAD> <BODY TEXT=white LINK=aqua VLINK=white ALINK=yellow BGCOLOR=black> <CENTER> <P CLASS=header><A HREF="SpecEquip.html">&lt;&lt;PREVIOUS</A> - <A HREF="../index.html">HOME</A> - <A HREF="../misc/contents.html">CONTENTS</A> - <A HREF="M57_20110802.html">NEXT&gt;&gt;</A><BR> <A HREF="index.html">NSI 2011 INDEX</A> - <A HREF="../misc/whatsnew.html"><IMG SRC="../gif/newcola.gif" ALT="New" WIDTH=28 HEIGHT=18 BORDER=0 ALIGN=ABSMIDDLE></A> </P> <TABLE BGCOLOR=BLACK CELLPADDING=2 WIDTH=1075 BORDER=0> <TR> <TD> <H2>Vega Low Resolution Spectrum<BR>Image August 2, 2011 at 11:04 am PDT</H2> <CENTER> <TABLE BGCOLOR=GRAY CELLPADDING=1> <TR ALIGN=CENTER> <TD> <IMG SRC="jpg/VegaA06-012s06crop.jpg" ALT="Vega Spectrum" WIDTH=624 HEIGHT=86 BORDER=0 ALIGN=MIDDLE> </TD> </TR> </TABLE> </CENTER> <P>&nbsp;<BR><B>Introduction</B></P> <P> The above image is the <A TARGET="_top" HREF="http://en.wikipedia.org/wiki/Star">star</A> <A TARGET="_top" HREF="http://en.wikipedia.org/wiki/Vega">Vega (Wikipedia)</A>. The round spectral order zero is on the left side of the image and its first order blazed <A TARGET="_top" HREF="http://en.wikipedia.org/wiki/Diffraction_grating">grating</A> spectrum is the horizontal line on the right side. The vertical stripes in the spectrum are absorption lines from the star and from the Earth's atmosphere. <UL> <LI>The star <A TARGET="_top" HREF="http://simbad.u-strasbg.fr/simbad/sim-id?Ident=Vega&NbIdent=1&Radius=2&Radius.unit=arcmin&submit=submit+id">Vega (CDS)</A> spectral type is <A TARGET="_top" HREF="https://www.cfa.harvard.edu/~pberlind/atlas/atframes.html">A0V</A> and its <A TARGET="_top" HREF="http://outreach.atnf.csiro.au/education/senior/astrophysics/spectral_class.html">luminosity class</A> is a V. <LI>Vega's spectrum is dominated by the <A TARGET="_top" HREF="http://en.wikipedia.org/wiki/Hydrogen">hydrogen</A> <A TARGET="_top" HREF="http://en.wikipedia.org/wiki/Balmer_series">Balmer series</A> <A TARGET="_top" HREF="http://en.wikipedia.org/wiki/H-alpha">H±</A>, H², H³, H´, Hµ and H¶ absorption lines. <UL> <LI><A TARGET="_top" HREF="http://spiff.rit.edu/classes/phys301/lectures/comp/comp.html">Deriving chemical composition from spectra</A> by Michael Richmond. </UL> <LI>Telluric <A TARGET="_top" HREF="http://en.wikipedia.org/wiki/Oxygen">O<sub>2</sub></A> and H<sub>2</sub>O absorption lines are observed. </UL> </P> <P> The round spectral order zero has <A HREF="http://www.ccd.com/ccd102.html">CCD blooming streaks</A> at the bottom of the star image because the exposure was optimized for the spectrum intensity and the CCD camera bloomed on the high intensity zero order star. In other words, the star is over exposed but the spectrum exposure is fine. </P> <P> The focus was optimized for H± part of the spectrum in preparation for imaging a quasar <A HREF="KUV18217+6419Analysis.html">KUV18217+6419</A> later in the evening. As a result, the short wavelength part of the spectrum (left side of the spectrum) is out of focus and is wider than the longer wavelengths (right side of the spectrum). The vertical absorption lines on the left side of the spectrum are the H¶, Hµ, H´, H³ and H² absorption lines. The vertical absorption lines on the right side of the spectrum are the H± absorption line and the telluric <A TARGET="_top" HREF="http://en.wikipedia.org/wiki/Oxygen">O<sub>2</sub></A> and H<sub>2</sub>O absorption lines. <UL> <LI>See <A HREF="../spectroscopy/DenebolaFocus.html">Spectrum Focusing on Denebola</A> for more details on spectrum changes caused by focusing. <LI>Focusing Procedure to Minimize Field Curvature Effect section of <A TARGET="_top" HREF="http://users.erols.com/njastro/faas/articles/west01.htm">Resolution Calculation for a Slitless Spectrograph</A> by Dr. Doug West </UL> </P> <CENTER><P></P><IMG SRC="../gif/starsbar.gif" WIDTH=500 HEIGHT=8><BR><P></P></CENTER> </TD> </TR> <TR> <TD> <P><B>Vega Spectrum Calibrated for Instrument Response</B></P> <IMG SRC="jpg/VegaA06-012s06crop4orderDataAInstrCal2.jpg" ALT="Vega Spectrum Chart" WIDTH=1073 HEIGHT=587 BORDER=0> <UL> <LI>The spectrum vertical axis is the intensity values of the spectrum image which have been calibrated for the instrument response. <LI>The red marks are measured data points. <LI>The spectrum horizontal axis is wavelength in <A TARGET="_top" HREF="http://en.wikipedia.org/wiki/Angstrom">angstroms</A> (Å). <LI>The yellow reference markers show hydrogen Balmer absorption lines (H±, H², H³, H´, Hµ and H¶) and <A TARGET="_top" HREF="http://en.wikipedia.org/wiki/Fraunhofer_lines">Fraunhofer</A> <A TARGET="_top" HREF="http://en.wikipedia.org/wiki/Telluric_contamination">telluric</A> <A TARGET="_top" HREF="http://en.wikipedia.org/wiki/Oxygen">O<sub>2</sub></A> <A TARGET="_top" HREF="http://en.wikipedia.org/wiki/Absorption_line">absorption bands/lines</A> (a, B, A, Z and y) and H<sub>2</sub>O absorption band. <LI>Below the spectrum chart is a synthesize color spectrum band generated from the spectrum data. </UL> <CENTER><P></P><IMG SRC="../gif/starsbar.gif" WIDTH=500 HEIGHT=8><BR><P></P></CENTER> </TD> </TR> <TR> <TD> <P><B>Vega Spectrum Compared to A0V Star in Pickels Synthetic Reference Library</B></P> <IMG SRC="jpg/VegaA06-012s06crop4orderDataAInstrCal3NoLab.jpg" ALT="Vega Spectrum Chart" WIDTH=1073 HEIGHT=587 BORDER=0> <UL> <LI>The A0V reference synthetic spectrum (blue line) is from RSpec Pickels reference library. <UL> <LI><A TARGET="_top" HREF="http://adsabs.harvard.edu//abs/1997yCat.7102....0P">Spectrophotometric Atlas of Standard Stellar Spectra (Pickles 1985)</A> <LI>The Pickles spectrum does not include the telluric bands and lines that are in Vega's spectrum. </UL><LI>The short wavelength absorption lines are weak because this part of the spectrum is not in sharp focus. The focus was optimize for the longer wavelengths. <LI>The shape of the continuum shows that the temperature of Vega peaks in the UV part of the spectrum. <UL> <LI><A TARGET="_top" href="http://astro.unl.edu/">NAAP</A> <A href="http://astro.unl.edu/classaction/animations/light/bbexplorer.html">Blackbody Curves</A> demonstration. <UL> <LI>Set the blackbody curve to Vega's temperature which is <A href="http://en.wikipedia.org/wiki/Vega">9602 ± 180 K</A>. <LI>Compare the above Vega spectrum with the blackbody curve at 9610 K. The blackbody curve peak is at 3015 Å which is in the UV part of the electromagnetic spectrum. <LI>Vega's spectrum continuum shape shows us its blackbody temperature. <LI>Vega spectrum drops on the left side because of the <A TARGET="_top" href="http://laserstars.org/spectra/BalmerJump.html">Balmer continuum (Balmer jump)</A> . Therefore, Vega's spectrum does not follow a blackbody curve at the shorter wavelengths. </UL> </UL> </UL> <CENTER> <A href="http://astro.unl.edu/classaction/animations/light/bbexplorer.html"><IMG SRC="jpg/capture_037_18092011_143903.jpg" ALT="NAAP Blackbody Curves demonstration" WIDTH=857 HEIGHT=499 BORDER=0></A> </CENTER> <CENTER><P></P><IMG SRC="../gif/starsbar.gif" WIDTH=500 HEIGHT=8><BR><P></P></CENTER> </TD> </TR> <TR> <TD> <P><B>Vega Spectrum (uncalibrated intensity data)</B></P> <IMG SRC="jpg/VegaA06-012s06crop4orderDataA.jpg" ALT="Vega Spectrum Chart" WIDTH=1073 HEIGHT=587 BORDER=0> <UL> <LI>This Vega spectrum shows the calibration of the horziontal axis in angstroms. <LI>The vertical axis is the spectrum intensity that has not been calibrated for the instrument response curve. See instrument response curve below at the bottom of this web page. </UL> <CENTER><P></P><IMG SRC="../gif/starsbar.gif" WIDTH=500 HEIGHT=8><BR><P></P></CENTER> </TD> </TR> <TR> <TD> <P><B>Vega Spectrum (uncalibrated intensity data) with the Continuum Removed</B></P> <IMG SRC="jpg/VegaA06-012s06crop4orderDataAFlat.jpg" ALT="Vega Spectrum Chart" WIDTH=1073 HEIGHT=587 BORDER=0> <UL> <LI>The above spectrum profile is the Vega spectrum (uncalibrated intensity data) that has been divided by the shape of its own continuum to remove the continuum. <LI>Notice how much more easly it is to see the <A TARGET="_top" HREF="http://en.wikipedia.org/wiki/Fraunhofer_lines">Fraunhofer</A> <A TARGET="_top" HREF="http://en.wikipedia.org/wiki/Telluric_contamination">telluric</A> <A TARGET="_top" HREF="http://en.wikipedia.org/wiki/Oxygen">O<sub>2</sub></A> <A TARGET="_top" HREF="http://en.wikipedia.org/wiki/Absorption_line">absorption bands/lines</A> (a, B, A, Z and y) <LI>The wavelength calibration for the Fraunhofer a and B absorption banda and H± absorption line are too short of wavelength on the spectrum. <LI>The difference between CCD camera pixels at H± is approximately 17.9 Å. </UL> </TD> </TR> <TR> <TD> <CENTER><P></P><IMG SRC="../gif/starsbar.gif" WIDTH=500 HEIGHT=8><BR><P></P></CENTER> <P><B>Imaging Processing</B> <UL> <LI><A TARGET="_top" HREF="http://www.cyanogen.com">Diffraction Limited</A> MaxIm DL V5.07. <UL> <LI>Crop star and spectrum. <LI>Save as FIT for RSpec and JPG for web site. </UL> </UL> </P> <A href="VegaA06-012s06_20110802_1100NonLinearNo0Cal.html#A"><IMG SRC="jpg/capture_007_18092011_083148.jpg" ALT="RSpec Non-Linear Calibration Wizard" WIDTH=483 HEIGHT=376 BORDER=0 ALIGN=RIGHT ></A> <P><B>Spectrum Calibration with RSpec</B></P> <UL> <LI><A TARGET="_top" HREF="http://www.rspec-astro.com">Field Tested Software</A> RSpec V1.3.0 (Build: 39). <LI>Used full 32-bit processing on FITS images. <LI>Used Auto-Open new files and Focus Tool to select <A HREF="VegaA06-001-018s06_20110802_1100.html">best image out of 18 images</A> taken. <LI>
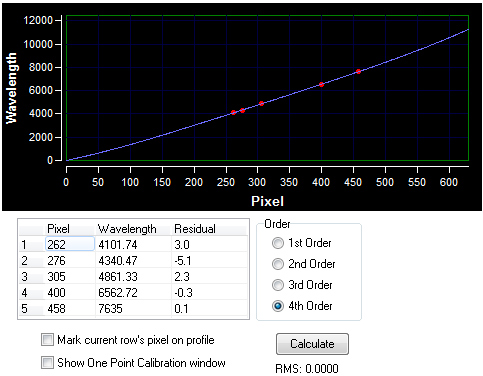
RSpec Calibration Wizard was used to calibrate the spectrum chart x axis in <A TARGET="_top" HREF="http://en.wikipedia.org/wiki/Angstrom">angstroms</A>. <LI>Eight different wavelegth calibrations were done. <UL> <LI>Four <A href="VegaA06-012s06_20110802_1100NonLinearCal.html">Vega spectrum angstroms calibrations with zero Order</A>. <LI>Four <A href="VegaA06-012s06_20110802_1100NonLinearNo0Cal.html">Vega spectrum angstroms calibrations without zero Order</A>. </UL> <LI>Fourth order calibration was selected without the zero order. <LI>The vertical axis was calibrated with the instrument response profile that is shown below. <LI>Spectrum chart labels were added. <LI>Spectrum chart colors were changed. <LI>Generate synthesize color spectrum. </UL> </P> <CENTER><P></P><IMG SRC="../gif/starsbar.gif" WIDTH=500 HEIGHT=8><BR><P></P></CENTER> </TD> </TR> <TR> <TD> <P><B>Instrument Response Profile</B></P> <IMG SRC="jpg/QSIRAWInstResponseSmooth7.jpg" ALT="Instrument Response Profile" WIDTH=1070 HEIGHT=587 BORDER=0> <CENTER><P></P><IMG SRC="../gif/starsbar.gif" WIDTH=500 HEIGHT=8><BR><P></P></CENTER> <P><B>Vega Spectrum Data</B></P> <UL> <LI><A TARGET="_top" HREF="http://www.rspec-astro.com">RSpec</A> V1.3.0 (Build: 39) data in <A HREF="data/VegaA06-012s06crop4orderDataA.zip">VegaA06-012s06crop4orderDataA.zip</A> <UL> <LI>VegaA06-012s06crop.fit <LI>VegaA06-012s06crop4orderData.dat <LI>VegaA06-012s06crop4orderData.ini <LI>VegaA06-012s06cropCal5pointsE.ini <LI>QSIRAWInstResponseSmooth7.dat </UL> </UL> <CENTER><P></P><IMG SRC="../gif/starsbar.gif" WIDTH=500 HEIGHT=8><BR><P></P></CENTER> <P><B>Observing Information</B> <UL> <LI>This spectrum was taken as during the <A HREF="index.html">PHYS508 Night Sky Institute Spectroscopy</A> workshop. <LI>OBS-Location: <A HREF="../PMO/index.html">Pine Mountain Observatory (PMO)</A> <LI>DATE-Local Time: August 2, 2011 at 11:04 am PDT. <LI>Image exposure: 0.6 seconds. </UL> </P> <P><B>Imaging Equipment</B> <UL> <LI><A HREF="SpecEquip.html#B">Rainbow Optics 200 lines/mm diffraction grating spectroscope</A> </UL> </P> <CENTER><P></P><IMG SRC="../gif/starsbar.gif" WIDTH=500 HEIGHT=8><BR><P></P></CENTER> <P><B>Vega Spectrum</B> <IMG SRC="../gif/links3.gif" ALT="Links" WIDTH=74 HEIGHT=30 BORDER=0 ALIGN=MIDDLE> <UL> <LI><A TARGET="_top" href="http://iopscience.iop.org/1538-3881/127/6/3508/204044.text.html">HUBBLE SPACE TELESCOPE ABSOLUTE SPECTROPHOTOMETRY OF VEGA FROM THE FAR-ULTRAVIOLET TO THE INFRARED</A> <LI>Absolute Flux Calibrated Spectrum of Vega <A TARGET="_top" href="http://www.stsci.edu/hst/observatory/documents/isrs/scs8.rev.pdf">PDF</A> by L. Colina, R. Bohlin, F. Castelli <LI><A TARGET="_top" href="http://astrosurf.com/buil/us/vatlas/vatlas.htm">Vega Spectrum Atlas</A> by Christian Buil <LI><A TARGET="_top" href="http://otobs.sakura.ne.jp/FBO/fko/dsctc/alp_lyr.htm">Alpha Lyr Spectrum</A> by Fujii Bisei Observatory <LI><A TARGET="_top" href="http://astrosurf.com/thizy/dss7/dss7.htm">Spectrograph SBIG DSS-7 spectrum of Vega</A> by Olivier THIZY <LI><A TARGET="_top" href="http://www.spektros.de/vega/vega.html">The Spectrum of Vega</A> by Günter <LI><A TARGET="_top" href="http://www.threehillsobservatory.co.uk/astro/spectra_5.htm">THE SPECTRUM OF VEGA</A> by THREE HILLS FLIP TOP OBSERVATORY <LI><A TARGET="_top" href="http://www.threehillsobservatory.co.uk/astro/spectra_28.htm">Low resolution spectrum of Vega</A> by THREE HILLS FLIP TOP OBSERVATORY <LI><A TARGET="_top" href="http://ned.ipac.caltech.edu/level5/ASS_Atlas/MK2_13.html">Atlas of Stellar Spectra</A> by Morgan * Keenan * Kellman <LI><A TARGET="_top" href="http://ned.ipac.caltech.edu/level5/Gray/Gray12.html">LUMINOSITY EFFECTS AT A0</A> A DIGITAL SPECTRAL CLASSIFICATION ATLAS by R. O. Gray <LI><A TARGET="_top" href="http://www.regulusastro.com/regulus/spectra/vega.html">Vega, Alpha Lyr, SAO 67174, Type A0Vvar</A> by John A. Blackwell </UL> </P> <CENTER><P></P><IMG SRC="../gif/starsbar.gif" WIDTH=500 HEIGHT=8><BR><P></P></CENTER> <H2><A HREF="../messier/testpatterns.html">Monitor Test Pattern</A></H2></CENTER> <P>The following test pattern is to help you adjust your monitor to best view the CCD astro images. The test pattern is used for adjusting monitor brightness, and contrast. Adjust monitor brightness and contrast to see all 16 gray scale levels. The most important adjustment when viewing astro images is to see the differences in all of the black bands. </P> <CENTER><IMG SRC="../messier/testpicts/16graybar.gif" WIDTH=402 HEIGHT=27></CENTER> </TD> </TR> </TABLE> </CENTER> <CENTER><P></P><IMG SRC="../gif/starsbar.gif" WIDTH=500 HEIGHT=8><BR><P></P></CENTER> <CENTER><P CLASS=navfooter> <A HREF="../index.html">Home</A> - <A HREF="../misc/whatsnew.html">What's&nbsp;New</A> - <A HREF="../misc/contents.html">Site&nbsp;Map</A> - <A HREF="../misc/obstypes.html">Observing</A> - <A HREF="../eyes/index.html">Unaided&nbsp;Eye</A> - <A HREF="../binoculars/index.html">Binoculars</A> - <A HREF="../telescopes/index.html">Telescopes</A> - <A HREF="../astrophoto/index.html">Astroimaging</A> - <A HREF="../messier/ccdimages.html">Images</A> - <A HREF="../skyevents/index.html">Sky&nbsp;Events</A> - <A HREF="../darksky/index.html">Dark&nbsp;Sky</A> - <A HREF="../solarsystem/index.html">Solar&nbsp;System</A> - <A HREF="../sun/index.html">Sun</A> - <A HREF="../moon/index.html">Moon</A> - <A HREF="../planets/index.html">Planets</A> - <A HREF="../mars/index.html">Mars</A> - <A HREF="../jupiter/index.html">Jupiter</A> - <A HREF="../saturn/index.html">Saturn</A> - <A HREF="../comets/index.html">Comets</A> - <A HREF="../meteors/index.html">Meteors</A> - <A HREF="../constel/starsindex.html">Stars</A> - <A HREF="../constel/constellations.html">Constellations</A> - <A HREF="../constel/allskymaps.html">Sky&nbsp;Maps</A> - <A HREF="../deepsky/deepsky.html">Deep&nbsp;Sky</A> - <A HREF="../equip/index.html">Equipment</A> - <A HREF="../ip/index.html">Image&nbsp;Processing</A> - <A HREF="../software/index.html">Software</A> - <A HREF="../starparty/index.html">Star&nbsp;Parties</A> - <A HREF="../its/index.html">Imaging&nbsp;the&nbsp;Sky</A> - <A HREF="../portland/index.html">Portland&nbsp;Astronomy</A> - <A HREF="../travels/index.html">Travels</A> - <A HREF="../websites/index.html">Web&nbsp;Sites</A> - <A HREF="../misc/glossary.html">Glossary</A> </P></CENTER> <P ALIGN="CENTER" CLASS=copyright><A HREF="../misc/copyright.html">&copy; 1998-2011 David Haworth</A></P> </BODY> </HTML>